🔎 Multi-Timeframe Analysis
4H Chart
Trend: Strong bearish structure intact, price consistently making lower lows.
Current Action: Price has bounced from 53,400 demand zone and is now testing supply around 54,000–54,200 (FVG + supply block).
Bias: Still bearish overall, but short-term relief rally is underway until this supply zone holds.
1H Chart
Trend: Recovery move inside a descending channel. Recent candles show strength but hitting 54,000 resistance zone.
Supply: 54,000–54,200 is a critical supply block. Above this, next resistance at 54,400–54,500.
Demand: Strong support sits near 53,400–53,500.
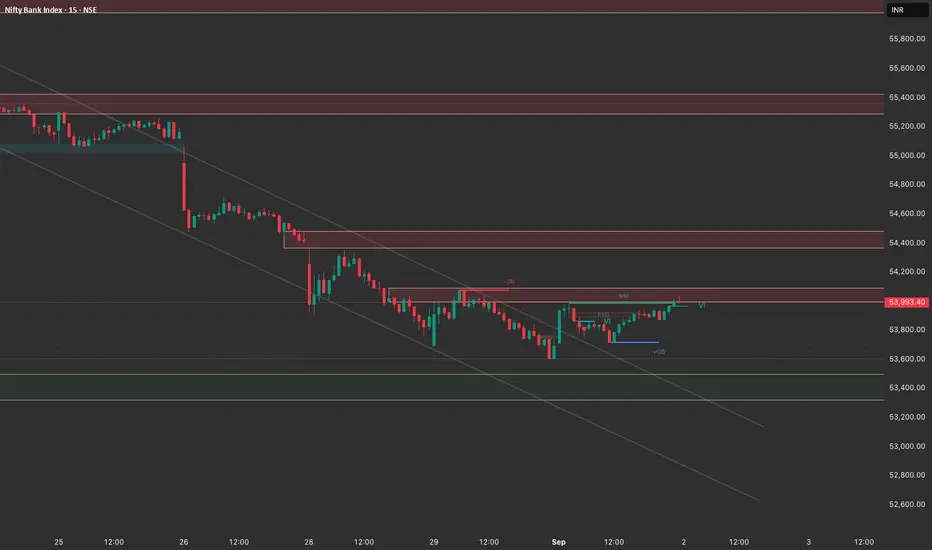
15M Chart
Structure: Clear break above intraday structure with higher highs and higher lows.
Immediate Resistance: Price is consolidating just below 54,000–54,100 supply.
Short-term Bias: Momentum bullish, but into heavy resistance.
🎯 Trade Plan for 2nd September
🔹 Scenario 1: Rejection at 54,000–54,200
If price rejects this supply zone with bearish candle confirmation:
Entry: Short near 54,000–54,100
Target 1: 53,700
Target 2: 53,400 (major demand zone)
Stop-Loss: Above 54,250
✅ Favorable Risk-Reward for trend continuation.
🔹 Scenario 2: Breakout above 54,200
If price sustains above 54,200 with volume:
Entry: Long above 54,250
Target 1: 54,500
Target 2: 54,800
Stop-Loss: Below 54,000
⚠️ More counter-trend, so reduce size.
🔹 Scalping Intraday (15M Setup)
Look for short entries at 54,000–54,100 zone rejection.
Quick longs possible only if 53,700–53,750 holds intraday as support.
📌 Summary:
Bigger picture = bearish bias.
Best probability = Sell on rise around 54,000–54,200.
Bulls only valid above 54,200 for a short-covering rally.
4H Chart
Trend: Strong bearish structure intact, price consistently making lower lows.
Current Action: Price has bounced from 53,400 demand zone and is now testing supply around 54,000–54,200 (FVG + supply block).
Bias: Still bearish overall, but short-term relief rally is underway until this supply zone holds.
1H Chart
Trend: Recovery move inside a descending channel. Recent candles show strength but hitting 54,000 resistance zone.
Supply: 54,000–54,200 is a critical supply block. Above this, next resistance at 54,400–54,500.
Demand: Strong support sits near 53,400–53,500.
15M Chart
Structure: Clear break above intraday structure with higher highs and higher lows.
Immediate Resistance: Price is consolidating just below 54,000–54,100 supply.
Short-term Bias: Momentum bullish, but into heavy resistance.
🎯 Trade Plan for 2nd September
🔹 Scenario 1: Rejection at 54,000–54,200
If price rejects this supply zone with bearish candle confirmation:
Entry: Short near 54,000–54,100
Target 1: 53,700
Target 2: 53,400 (major demand zone)
Stop-Loss: Above 54,250
✅ Favorable Risk-Reward for trend continuation.
🔹 Scenario 2: Breakout above 54,200
If price sustains above 54,200 with volume:
Entry: Long above 54,250
Target 1: 54,500
Target 2: 54,800
Stop-Loss: Below 54,000
⚠️ More counter-trend, so reduce size.
🔹 Scalping Intraday (15M Setup)
Look for short entries at 54,000–54,100 zone rejection.
Quick longs possible only if 53,700–53,750 holds intraday as support.
📌 Summary:
Bigger picture = bearish bias.
Best probability = Sell on rise around 54,000–54,200.
Bulls only valid above 54,200 for a short-covering rally.
إخلاء المسؤولية
لا يُقصد بالمعلومات والمنشورات أن تكون، أو تشكل، أي نصيحة مالية أو استثمارية أو تجارية أو أنواع أخرى من النصائح أو التوصيات المقدمة أو المعتمدة من TradingView. اقرأ المزيد في شروط الاستخدام.
إخلاء المسؤولية
لا يُقصد بالمعلومات والمنشورات أن تكون، أو تشكل، أي نصيحة مالية أو استثمارية أو تجارية أو أنواع أخرى من النصائح أو التوصيات المقدمة أو المعتمدة من TradingView. اقرأ المزيد في شروط الاستخدام.