🏦 BANK NIFTY – Falling Wedge Breakout with Bullish Momentum | 15-Min Chart
📅 Date: May 5, 2025
📈 Timeframe: 15-Minute
🔍 Instrument: Nifty Bank Index (NSE)
📌 Technical Overview:
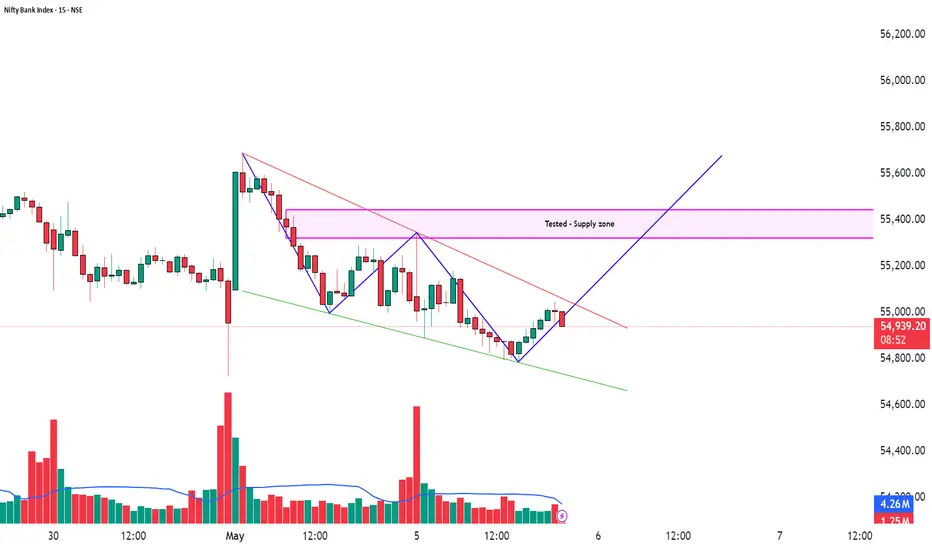
Bank Nifty is currently showing signs of a short-term bullish reversal on the 15-minute chart. The index formed a classic falling wedge pattern, which is typically seen before upward price moves. A recent breakout attempt is seen from the wedge structure, supported by steady green candles and slight volume recovery.
🧩 Chart Pattern:
The Falling Wedge is marked by two converging green trendlines.
Inside the wedge, the price made lower highs and lower lows, forming a compact structure.
The breakout leg is forming with strength and is approaching a tested supply zone around 55,350–55,450.
🔍 Key Price Levels:
Support Zone: ~54,800 (Lower boundary of the wedge)
Immediate Resistance: ~55,350 (Tested supply zone)
Current Market Price (CMP): 55,001.65
If the price sustains above 55,070 and breaks out with volume, we may see bullish continuation toward 55,350–55,600.
📊 Volume Analysis:
Volume remained low during the wedge formation – a healthy sign.
A volume breakout confirmation is awaited.
Keep an eye on a green volume bar spike as price crosses wedge resistance.
🧠 Observational Bias:
As long as price holds above 54,800, the short-term bias remains bullish.
A successful retest of the breakout zone or a strong close above 55,070 with volume may offer a high-probability intraday opportunity.
📌Note: Traders can wait for a confirmation candle (close above wedge) before entering.
Risk management is key—keep stop loss below 54,800.
📅 Date: May 5, 2025
📈 Timeframe: 15-Minute
🔍 Instrument: Nifty Bank Index (NSE)
📌 Technical Overview:
Bank Nifty is currently showing signs of a short-term bullish reversal on the 15-minute chart. The index formed a classic falling wedge pattern, which is typically seen before upward price moves. A recent breakout attempt is seen from the wedge structure, supported by steady green candles and slight volume recovery.
🧩 Chart Pattern:
The Falling Wedge is marked by two converging green trendlines.
Inside the wedge, the price made lower highs and lower lows, forming a compact structure.
The breakout leg is forming with strength and is approaching a tested supply zone around 55,350–55,450.
🔍 Key Price Levels:
Support Zone: ~54,800 (Lower boundary of the wedge)
Immediate Resistance: ~55,350 (Tested supply zone)
Current Market Price (CMP): 55,001.65
If the price sustains above 55,070 and breaks out with volume, we may see bullish continuation toward 55,350–55,600.
📊 Volume Analysis:
Volume remained low during the wedge formation – a healthy sign.
A volume breakout confirmation is awaited.
Keep an eye on a green volume bar spike as price crosses wedge resistance.
🧠 Observational Bias:
As long as price holds above 54,800, the short-term bias remains bullish.
A successful retest of the breakout zone or a strong close above 55,070 with volume may offer a high-probability intraday opportunity.
📌Note: Traders can wait for a confirmation candle (close above wedge) before entering.
Risk management is key—keep stop loss below 54,800.
تم إغلاق الصفقة يدويًا
54,800 breachedSTWP | Mentor & Demand-Supply Specialist | Empowering traders through structured learning |
simpletradewithpatience.com
Community: chat.whatsapp.com/BEYz0tkqP0fJPBCWf59uel
wa.me/message/6IOPHGOXMGZ4N1
Educational Only
simpletradewithpatience.com
Community: chat.whatsapp.com/BEYz0tkqP0fJPBCWf59uel
wa.me/message/6IOPHGOXMGZ4N1
Educational Only
منشورات ذات صلة
إخلاء المسؤولية
لا يُقصد بالمعلومات والمنشورات أن تكون، أو تشكل، أي نصيحة مالية أو استثمارية أو تجارية أو أنواع أخرى من النصائح أو التوصيات المقدمة أو المعتمدة من TradingView. اقرأ المزيد في شروط الاستخدام.
STWP | Mentor & Demand-Supply Specialist | Empowering traders through structured learning |
simpletradewithpatience.com
Community: chat.whatsapp.com/BEYz0tkqP0fJPBCWf59uel
wa.me/message/6IOPHGOXMGZ4N1
Educational Only
simpletradewithpatience.com
Community: chat.whatsapp.com/BEYz0tkqP0fJPBCWf59uel
wa.me/message/6IOPHGOXMGZ4N1
Educational Only
منشورات ذات صلة
إخلاء المسؤولية
لا يُقصد بالمعلومات والمنشورات أن تكون، أو تشكل، أي نصيحة مالية أو استثمارية أو تجارية أو أنواع أخرى من النصائح أو التوصيات المقدمة أو المعتمدة من TradingView. اقرأ المزيد في شروط الاستخدام.