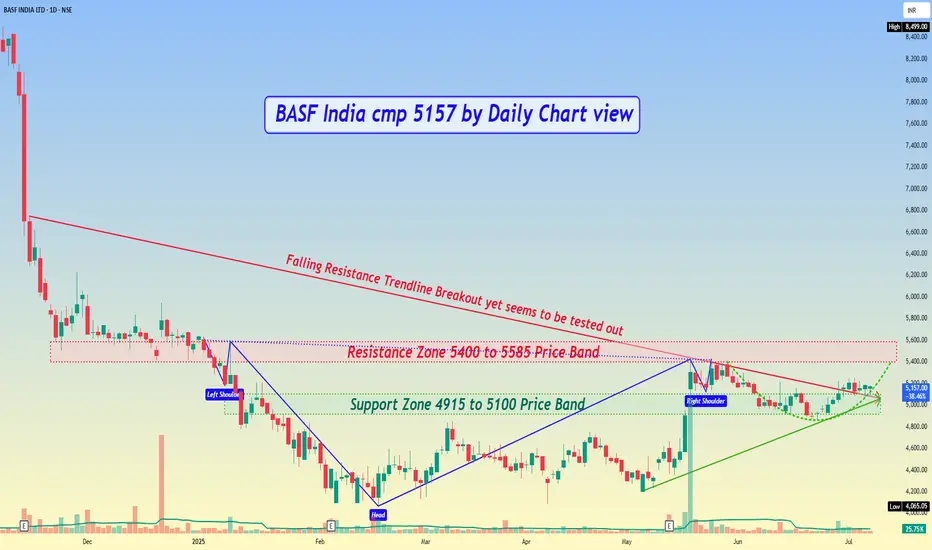
BASF India cmp 5157 by Daily Chart view
- Support Zone 4915 to 5100 Price Band
- Resistance Zone 5400 to 5585 Price Band
- Stock Price is in the process of Support Zone testing retesting
- Falling Resistance Trendline Breakout yet seems to be tested out
- Rising Support Trendline seems well respected and price well above it
- Bullish Head & Shoulder followed by a Rounding Bottom in completion stage
- Volumes seem to be on selling side, need to increase for fresh upside price movement
- Majority of the Technical Indicators seem to be turning positive for BB, EMA, MACD, RSI, SAR
إخلاء المسؤولية
لا يُقصد بالمعلومات والمنشورات أن تكون، أو تشكل، أي نصيحة مالية أو استثمارية أو تجارية أو أنواع أخرى من النصائح أو التوصيات المقدمة أو المعتمدة من TradingView. اقرأ المزيد في شروط الاستخدام.
إخلاء المسؤولية
لا يُقصد بالمعلومات والمنشورات أن تكون، أو تشكل، أي نصيحة مالية أو استثمارية أو تجارية أو أنواع أخرى من النصائح أو التوصيات المقدمة أو المعتمدة من TradingView. اقرأ المزيد في شروط الاستخدام.