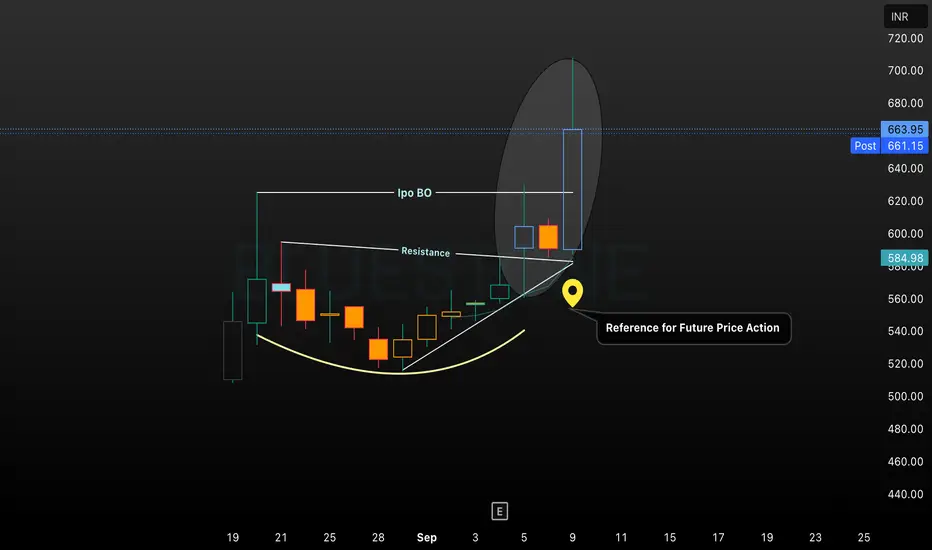
This chart analysis for Bluestone visualizes a bullish IPO breakout above resistance, confirmed by a rounded bottom base pattern and strong candle momentum. The highlighted reference marker identifies a crucial price level for monitoring future action, supporting technical study and trading decisions. Visual annotations emphasize breakout confirmation and the significance of post-breakout levels for trend continuation monitoring.
إخلاء المسؤولية
لا يُقصد بالمعلومات والمنشورات أن تكون، أو تشكل، أي نصيحة مالية أو استثمارية أو تجارية أو أنواع أخرى من النصائح أو التوصيات المقدمة أو المعتمدة من TradingView. اقرأ المزيد في شروط الاستخدام.
إخلاء المسؤولية
لا يُقصد بالمعلومات والمنشورات أن تكون، أو تشكل، أي نصيحة مالية أو استثمارية أو تجارية أو أنواع أخرى من النصائح أو التوصيات المقدمة أو المعتمدة من TradingView. اقرأ المزيد في شروط الاستخدام.