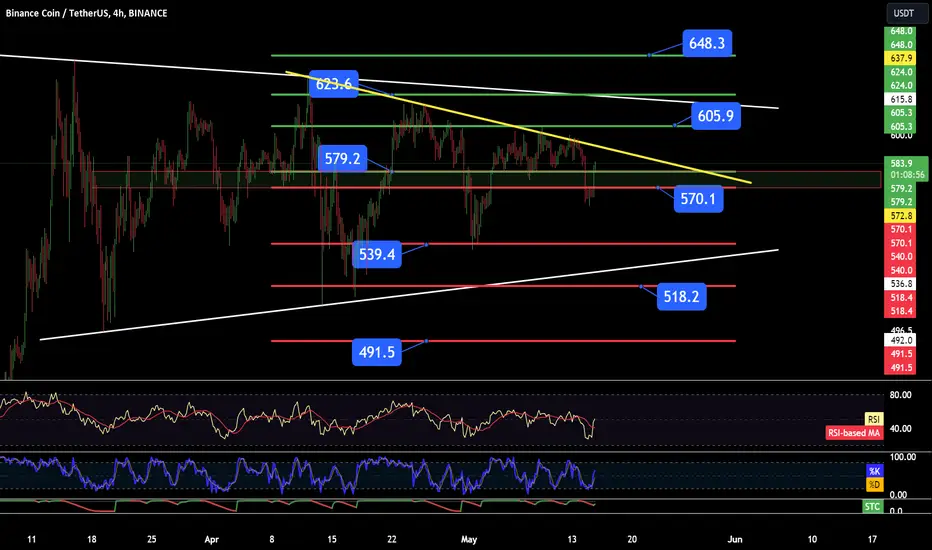
Hello everyone, let's look at the 4H BNB to USDT chart, in this situation we can see how the price is moving in a sideways trend channel, staying below the local downtrend line.
Let's start by setting goals for the near future that we can include:
T1 = USD 579.2 at which the price struggles
T2 = $605.9
T3 = $623.6
AND
T4 = $648.3
Now let's move on to the stop-loss in case of further market declines:
SL1 = $570.1
SL2 = $539.4
SL3 = $518.2
AND
SL4 = $491.50
Let's start by setting goals for the near future that we can include:
T1 = USD 579.2 at which the price struggles
T2 = $605.9
T3 = $623.6
AND
T4 = $648.3
Now let's move on to the stop-loss in case of further market declines:
SL1 = $570.1
SL2 = $539.4
SL3 = $518.2
AND
SL4 = $491.50
إخلاء المسؤولية
لا يُقصد بالمعلومات والمنشورات أن تكون، أو تشكل، أي نصيحة مالية أو استثمارية أو تجارية أو أنواع أخرى من النصائح أو التوصيات المقدمة أو المعتمدة من TradingView. اقرأ المزيد في شروط الاستخدام.
إخلاء المسؤولية
لا يُقصد بالمعلومات والمنشورات أن تكون، أو تشكل، أي نصيحة مالية أو استثمارية أو تجارية أو أنواع أخرى من النصائح أو التوصيات المقدمة أو المعتمدة من TradingView. اقرأ المزيد في شروط الاستخدام.