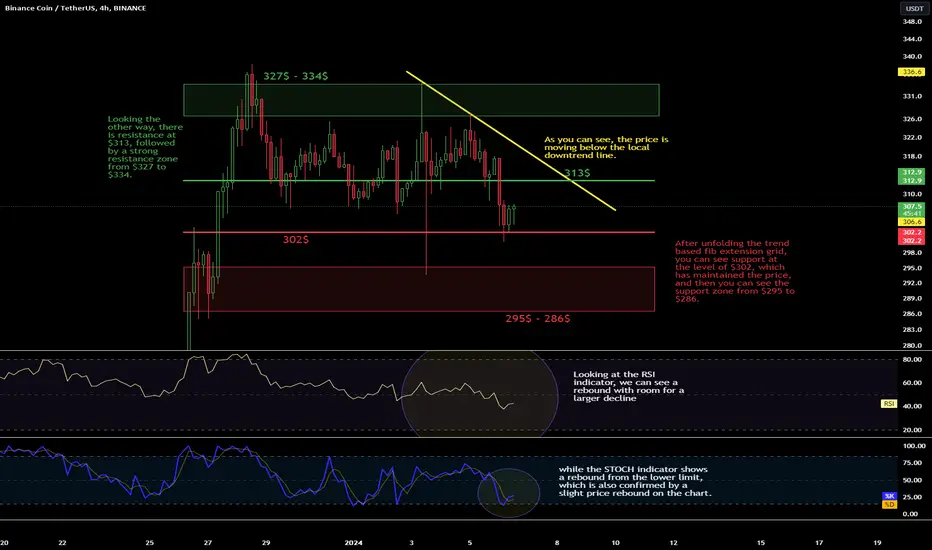
Hello everyone, let's take a look at the BNB to USDT chart on a four-hour time frame. As you can see, the price is moving below the local downtrend line.
After unfolding the trend based fib extension grid, you can see support at the level of $302, which has maintained the price, and then you can see the support zone from $295 to $286.
Looking the other way, there is resistance at $313, followed by a strong resistance zone from $327 to $334.
Looking at the RSI indicator, we can see a rebound with room for a larger decline, while the STOCH indicator shows a rebound from the lower limit, which is also confirmed by a slight price rebound on the chart.
إخلاء المسؤولية
لا يُقصد بالمعلومات والمنشورات أن تكون، أو تشكل، أي نصيحة مالية أو استثمارية أو تجارية أو أنواع أخرى من النصائح أو التوصيات المقدمة أو المعتمدة من TradingView. اقرأ المزيد في شروط الاستخدام.
إخلاء المسؤولية
لا يُقصد بالمعلومات والمنشورات أن تكون، أو تشكل، أي نصيحة مالية أو استثمارية أو تجارية أو أنواع أخرى من النصائح أو التوصيات المقدمة أو المعتمدة من TradingView. اقرأ المزيد في شروط الاستخدام.