BSE is trading at ₹2,054.60, reflecting a 2.04% decline for the day.
📊 1-Hour Time Frame Technical Analysis
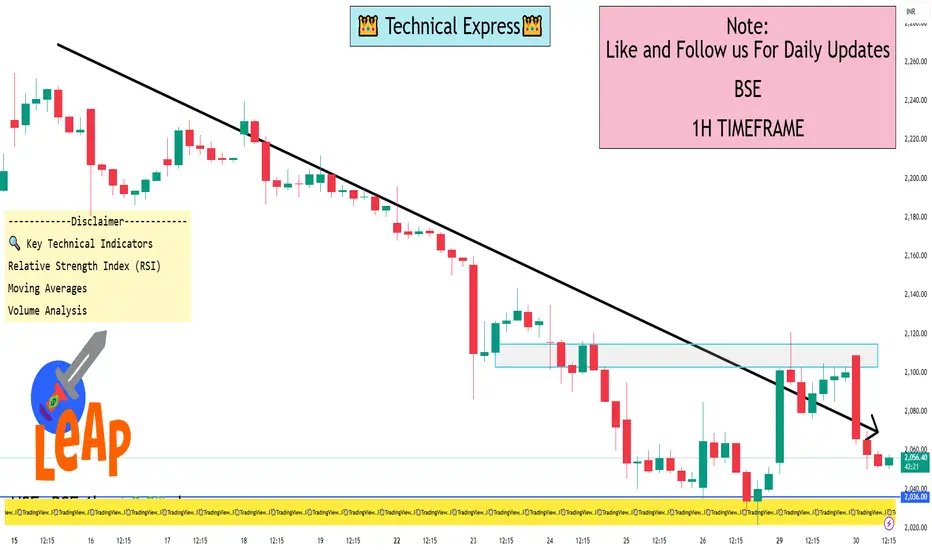
On the 1-hour chart, BSE Ltd. is exhibiting a "Strong Sell" signal across both technical indicators and moving averages. This suggests a prevailing short-term downtrend, with the stock trading below its key moving averages.
🔍 Key Technical Indicators
Relative Strength Index (RSI): Currently below 30, indicating the stock is in oversold territory and may be due for a short-term rebound.
Moving Averages: The stock is trading below its 5-day, 20-day, 50-day, 100-day, and 200-day moving averages, suggesting a bearish trend.
Volume Analysis: Recent trading volumes have been lower than average, indicating reduced investor participation.
📈 Support and Resistance Levels
Immediate Support: ₹2,000
Immediate Resistance: ₹2,100
A break below ₹2,000 could signal further downside, while a move above ₹2,100 may indicate a potential reversal.
⚠️ Considerations for Traders
Given the current "Strong Sell" signals, traders should exercise caution. It's advisable to wait for confirmation of a trend reversal before entering long positions. Utilizing a multi-timeframe analysis can provide a more comprehensive view of the stock's potential movements.
📊 1-Hour Time Frame Technical Analysis
On the 1-hour chart, BSE Ltd. is exhibiting a "Strong Sell" signal across both technical indicators and moving averages. This suggests a prevailing short-term downtrend, with the stock trading below its key moving averages.
🔍 Key Technical Indicators
Relative Strength Index (RSI): Currently below 30, indicating the stock is in oversold territory and may be due for a short-term rebound.
Moving Averages: The stock is trading below its 5-day, 20-day, 50-day, 100-day, and 200-day moving averages, suggesting a bearish trend.
Volume Analysis: Recent trading volumes have been lower than average, indicating reduced investor participation.
📈 Support and Resistance Levels
Immediate Support: ₹2,000
Immediate Resistance: ₹2,100
A break below ₹2,000 could signal further downside, while a move above ₹2,100 may indicate a potential reversal.
⚠️ Considerations for Traders
Given the current "Strong Sell" signals, traders should exercise caution. It's advisable to wait for confirmation of a trend reversal before entering long positions. Utilizing a multi-timeframe analysis can provide a more comprehensive view of the stock's potential movements.
I built a Buy & Sell Signal Indicator with 85% accuracy.
📈 Get access via DM or
WhatsApp: wa.link/d997q0
Contact - +91 76782 40962
| Email: techncialexpress@gmail.com
| Script Coder | Trader | Investor | From India
📈 Get access via DM or
WhatsApp: wa.link/d997q0
Contact - +91 76782 40962
| Email: techncialexpress@gmail.com
| Script Coder | Trader | Investor | From India
منشورات ذات صلة
إخلاء المسؤولية
لا يُقصد بالمعلومات والمنشورات أن تكون، أو تشكل، أي نصيحة مالية أو استثمارية أو تجارية أو أنواع أخرى من النصائح أو التوصيات المقدمة أو المعتمدة من TradingView. اقرأ المزيد في شروط الاستخدام.