Hello
It's a Bitcoinguide.
If you have a "follower"
You can receive comment notifications on real-time travel routes and major sections.
If my analysis is helpful,
I would like one booster button at the bottom, please.
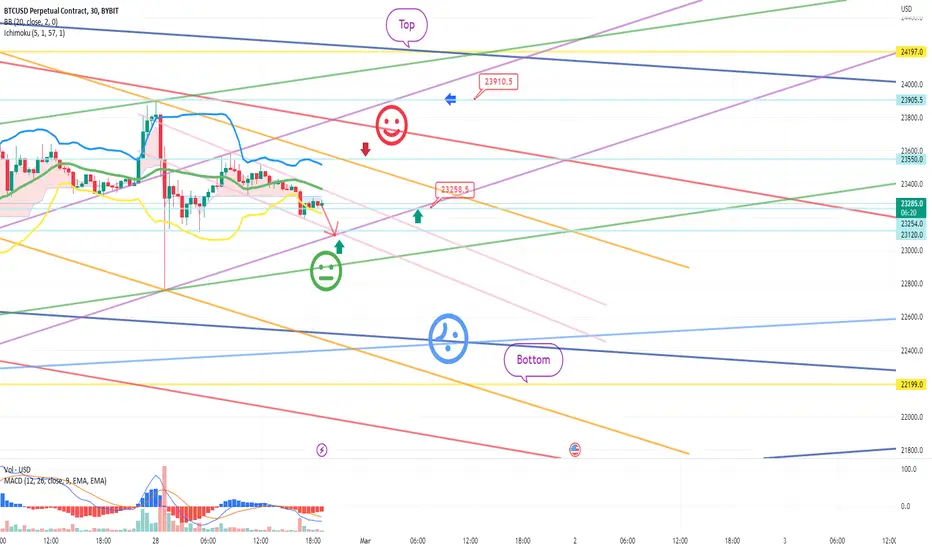
Bitcoin 30 minute chart.
It's a two-way neutral strategy.
Today, the possibility of sideways movement is very high.
*At the red arrow path
1. Entry into long position at $23,120 / stop loss when breaking the green support line
$23550 short position / stop loss when the red resistance line is broken
Whichever of the two arrives first
You may want to enter.
(From the current position, if there is no place to enter the bottom long, from the top short in case of a rebound)
2. $23258.5 long position switching / stop loss when breaking the green support line
-> 1st target of red resistance line -> 2nd target of final $23910.5
In case of maintaining without breaking the final green support line
Circulation pumping may occur in job altcoins, so check it.
There is an indicator announcement at 12:00 tonight, so please refer to it.
Please pay attention to the Nasdaq movement.
My analysis is for reference only.
I hope you will operate safely with principle trading and stop loss essential.
I'll take off tomorrow Wednesday and see you on Thursday.
thank you.
أغلقت الصفقة: تم الوصول للهدف
Helloit's a BitcoinGuide.
This is the movement after writing the NASDAQ analysis article.
The major sections were marked with a black finger.
Follow the sky blue finger movement path
Long -> short switching finish
After that, yesterday was March 1st, so I took a day off from analysis.
The orange resistance line -> the decline ends to the light blue support line.
A gap section was created at the top
Yesterday's movement opened the downside.
This is the period just before the break of the previous low.
If this section is broken, in the last support section
The direction seems to be determined.
This is the movement after writing the bitcoin analysis article.
The major sections were marked with a black finger.
follow the red arrow path
Break through the red resistance line without breaking the green support line
As indicated,
23550 short -> 23258 long -> up to target 23910.5
Perfect / Excessive processing complete.
Yesterday was a day off from analysis.
Because the Nasdaq is yet to break the previous low.
Bitcoin looks fine.
Because it is coupled according to the Nasdaq movement
It seems that the rest of this week should be focused and watched.
I'll check the whole thing
thank you
*비트코인가이드 공식텔레그램 Telegram
t.me/BTG_Group
*빙엑스 BingX 50%DC+$5,000 (총1회수수료)
bingx.com/invite/YBM3A4
*바이비트 Bybit 20%DC+$5,020
partner.bybit.com/b/Bitcoin_Guide
*앞으로는 하단의 네이버카페에서만 활동합니다.
cafe.naver.com/loanlife82
t.me/BTG_Group
*빙엑스 BingX 50%DC+$5,000 (총1회수수료)
bingx.com/invite/YBM3A4
*바이비트 Bybit 20%DC+$5,020
partner.bybit.com/b/Bitcoin_Guide
*앞으로는 하단의 네이버카페에서만 활동합니다.
cafe.naver.com/loanlife82
منشورات ذات صلة
إخلاء المسؤولية
لا يُقصد بالمعلومات والمنشورات أن تكون، أو تشكل، أي نصيحة مالية أو استثمارية أو تجارية أو أنواع أخرى من النصائح أو التوصيات المقدمة أو المعتمدة من TradingView. اقرأ المزيد في شروط الاستخدام.
