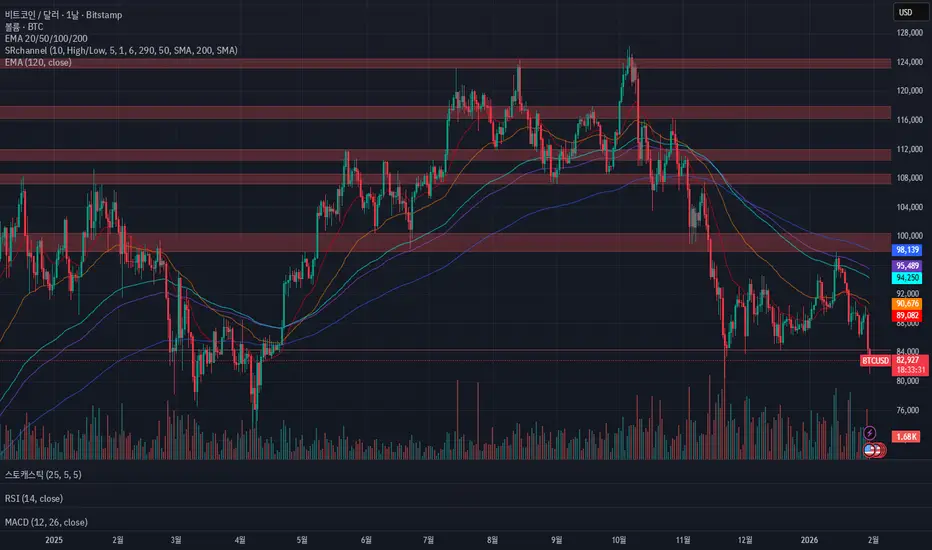
This chart shows Bitcoin’s current market structure across multiple timeframes, including key support and resistance levels, trend direction, and momentum indicators.
It is designed for monitoring price action and identifying potential trading opportunities based on trend continuation or reversal signals.
This setup is used as part of a personal trading dashboard for tracking Bitcoin in real time.
It is designed for monitoring price action and identifying potential trading opportunities based on trend continuation or reversal signals.
This setup is used as part of a personal trading dashboard for tracking Bitcoin in real time.
إخلاء المسؤولية
لا يُقصد بالمعلومات والمنشورات أن تكون، أو تشكل، أي نصيحة مالية أو استثمارية أو تجارية أو أنواع أخرى من النصائح أو التوصيات المقدمة أو المعتمدة من TradingView. اقرأ المزيد في شروط الاستخدام.
إخلاء المسؤولية
لا يُقصد بالمعلومات والمنشورات أن تكون، أو تشكل، أي نصيحة مالية أو استثمارية أو تجارية أو أنواع أخرى من النصائح أو التوصيات المقدمة أو المعتمدة من TradingView. اقرأ المزيد في شروط الاستخدام.