Indicators
Smart Money Support/Resistance (Lite) & ATAI Volume Analysis with Price Action V1.03
Analytical Setup
• LTF: 10 seconds
• LTF Coverage Bars: 70
• Global Volume Period: 52
• Market Type: Range
• Active Zones:
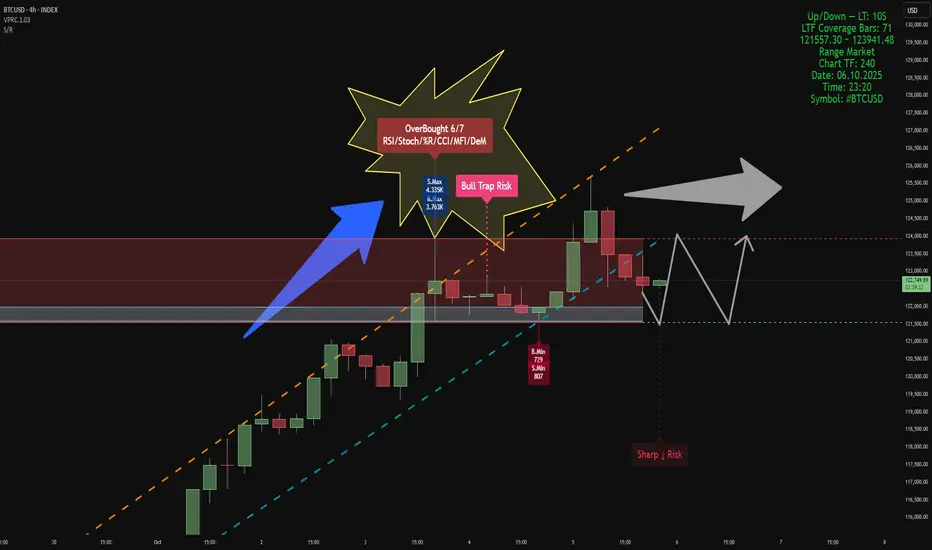
- Support Zone: 121,557 – 123,941 USD (current active range shown in panel)
The analysis timeframe ensures valid volume coverage, as the period (52) is smaller than total LTF bars (70).
Resistance Area & Bull Trap Risk
In the upper range (≈123,900 USD), a Bull Trap Risk has formed immediately after an OverBought 6/7 condition — confirmed by RSI, Stoch, %R, CCI, MFI, and DeM modules in ATAI. At this point, both buy and sell volumes peaked within the 52-bar window, with S.Max = 4.33K and B.Max = 3.76K. This slight dominance by sellers indicates demand absorption at the top of the structure. The setup matches ATAI’s trap logic — high wick, overbought context, and volume imbalance — signaling potential exhaustion near resistance.
Support Area
Support is currently anchored near 121,550 USD, derived from B.Min and S.Min lows (B.Min = 7.29, S.Min = 807). This aligns with the lower projection from Smart Money S/R, marking the point where cumulative delta begins to compress. Historically, compression at minimum-volume zones often precedes short-term accumulation or range stabilization.
Structural Behavior
The chart shows a defined upward channel (orange and cyan dashed lines). After testing the upper boundary, price entered the resistance zone and generated a Bull Trap Risk followed by moderate rejection. Below, the Sharp ↓ Risk tag signals potential for a short liquidity sweep before stabilization. Volume readings still support range continuation rather than a confirmed reversal, consistent with the Range Market tag.
Probable Scenario
1. A short pullback toward the lower boundary of support (~121.5K) is expected.
2. If support holds and volume compression persists, a rebound toward 123.9K (resistance ceiling) is probable.
3. A breakdown below 121.5K could trigger a deeper correction toward the next S/R projection near 120K.
This represents a neutral-to-bullish range bias: short-term weakness, but constructive above support.
Summary
• OverBought 6/7 + Bull Trap Risk detected at resistance (≈123.9K).
• Support around 121.5K built from B.Min and S.Min.
• Sellers slightly dominant at the trap peak.
• Likely scenario: retest of support, then rebound toward resistance if volume confirms.
• Bias: range continuation until breakout beyond 123.9K or breakdown below 121.5K.
تم فتح الصفقة
BTCUSD – 4H Volume-Structure UpdateAfter our previous analysis, BTC moved exactly as projected — a correction followed the OverBought (6/7) zone and Bull Trap Risk signal.
Price is now consolidating between 121,500 – 124,000, confirming a short-term range structure.
At this stage, market momentum remains neutral; volume flow suggests buyers and sellers are balancing around the mid-range.
A breakout above 124,500 could open the path toward 126,000, while a drop below 121,000 may extend the correction toward 118,000.
Let’s keep watching how volume dynamics evolve here. 📊
منشورات ذات صلة
إخلاء المسؤولية
لا يُقصد بالمعلومات والمنشورات أن تكون، أو تشكل، أي نصيحة مالية أو استثمارية أو تجارية أو أنواع أخرى من النصائح أو التوصيات المقدمة أو المعتمدة من TradingView. اقرأ المزيد في شروط الاستخدام.
منشورات ذات صلة
إخلاء المسؤولية
لا يُقصد بالمعلومات والمنشورات أن تكون، أو تشكل، أي نصيحة مالية أو استثمارية أو تجارية أو أنواع أخرى من النصائح أو التوصيات المقدمة أو المعتمدة من TradingView. اقرأ المزيد في شروط الاستخدام.