Bitcoin has had an impressive year, breaking out of a downward channel and launching into a strong upward rally as we saw in the previous idea.

But now, price action is slowing, and many are asking: Is the bull run over or just taking a breather?
Let’s look at what the chart tells us.
📈 A Classic Bull Flag in the Making
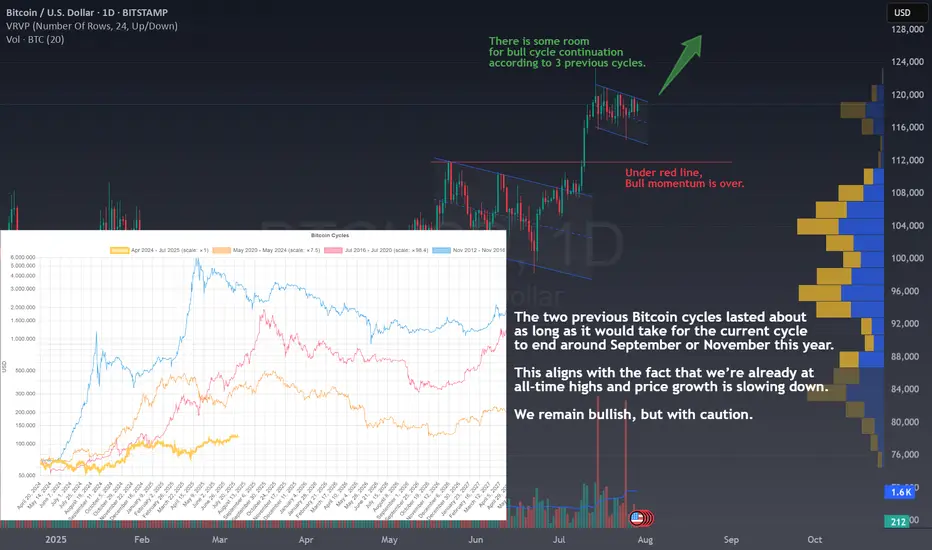
After the breakout, BTC seems to be forming another channel or what traders often call a bull flag. This is typically a bullish continuation pattern, meaning that after a short consolidation, price may break upward again.
But that’s the technical side. What about the big picture?
🔁 Bitcoin Cycles: History Rhymes
In the chart below the price, we see a comparison of Bitcoin’s last two cycles (shown in red and orange). Interestingly, both of those cycles point to end between September and November this year.
If history repeats, or at least rhymes, the current cycle could follow the same timeline. That gives us a few more months of potential upside before this bull run starts cooling off.
Note that the first cycle peaked faster, but also had a mini bull momentum in the same zone where the next cycles peaked.
⚠️ Still Bullish, But Watch Your Step
Even though we’re near all-time highs and price is showing signs of slowing, there may still be room for growth. However, the risk is increasing, so this is a time to stay bullish but with extra caution.
A key level to watch is marked in red on the chart. Falling below it could mean the bull momentum is fading. The reason is quite simple, a bull rally can't trade inside prices of previous consolidation phases because that means lateral or bear momentum.
🧠 Final Thoughts
Bitcoin has a history of repeating patterns, and right now, we seem to be tracking closely to previous cycles. With a potential breakout forming and a few months left on the clock, there could still be opportunities ahead.
But don’t forget: every cycle ends. Stay alert, manage risk, and don’t chase green candles blindly.
💬 Does this setup align with your view on BTCUSD ?
🚀 Hit the rocket if this helped you spot the opportunity and follow for more clean, educational trade ideas!
But now, price action is slowing, and many are asking: Is the bull run over or just taking a breather?
Let’s look at what the chart tells us.
📈 A Classic Bull Flag in the Making
After the breakout, BTC seems to be forming another channel or what traders often call a bull flag. This is typically a bullish continuation pattern, meaning that after a short consolidation, price may break upward again.
But that’s the technical side. What about the big picture?
🔁 Bitcoin Cycles: History Rhymes
In the chart below the price, we see a comparison of Bitcoin’s last two cycles (shown in red and orange). Interestingly, both of those cycles point to end between September and November this year.
If history repeats, or at least rhymes, the current cycle could follow the same timeline. That gives us a few more months of potential upside before this bull run starts cooling off.
Note that the first cycle peaked faster, but also had a mini bull momentum in the same zone where the next cycles peaked.
⚠️ Still Bullish, But Watch Your Step
Even though we’re near all-time highs and price is showing signs of slowing, there may still be room for growth. However, the risk is increasing, so this is a time to stay bullish but with extra caution.
A key level to watch is marked in red on the chart. Falling below it could mean the bull momentum is fading. The reason is quite simple, a bull rally can't trade inside prices of previous consolidation phases because that means lateral or bear momentum.
🧠 Final Thoughts
Bitcoin has a history of repeating patterns, and right now, we seem to be tracking closely to previous cycles. With a potential breakout forming and a few months left on the clock, there could still be opportunities ahead.
But don’t forget: every cycle ends. Stay alert, manage risk, and don’t chase green candles blindly.
💬 Does this setup align with your view on
🚀 Hit the rocket if this helped you spot the opportunity and follow for more clean, educational trade ideas!
تم فتح الصفقة
Be careful with this V-shaped end, this could be a major signal of trend change. While we don't lose the red line, I'm still bullish, but the last pattern shown by BTC is not bullishأغلقت الصفقة: تم الوصول للهدف
Closed at the target shown in the chart.⚡ Trading is not about luck or patience. Is about skills and knowledge. ⚡
I share my ideas, returns and knowledge here:
📚 👉 topchartpatterns.substack.com/subscribe 👈📚
🤝 Business contact: info@topchartpatterns.com
I share my ideas, returns and knowledge here:
📚 👉 topchartpatterns.substack.com/subscribe 👈📚
🤝 Business contact: info@topchartpatterns.com
منشورات ذات صلة
إخلاء المسؤولية
لا يُقصد بالمعلومات والمنشورات أن تكون، أو تشكل، أي نصيحة مالية أو استثمارية أو تجارية أو أنواع أخرى من النصائح أو التوصيات المقدمة أو المعتمدة من TradingView. اقرأ المزيد في شروط الاستخدام.
⚡ Trading is not about luck or patience. Is about skills and knowledge. ⚡
I share my ideas, returns and knowledge here:
📚 👉 topchartpatterns.substack.com/subscribe 👈📚
🤝 Business contact: info@topchartpatterns.com
I share my ideas, returns and knowledge here:
📚 👉 topchartpatterns.substack.com/subscribe 👈📚
🤝 Business contact: info@topchartpatterns.com
منشورات ذات صلة
إخلاء المسؤولية
لا يُقصد بالمعلومات والمنشورات أن تكون، أو تشكل، أي نصيحة مالية أو استثمارية أو تجارية أو أنواع أخرى من النصائح أو التوصيات المقدمة أو المعتمدة من TradingView. اقرأ المزيد في شروط الاستخدام.