Hi Everyone – well what a week last week was, incredible stuff. For the second time this year Bitcoin made a move which left people completely stunned. Sure, the 61/8% retracement is a good place to buy and something we have been tracking for some time, but a 40% upswing in one day off the back of some China news is unprecedented even for Bitcoin given its market Cap today.
So I wanted to bring you my thoughts as to what’s occurring given that we have had such a defining move.
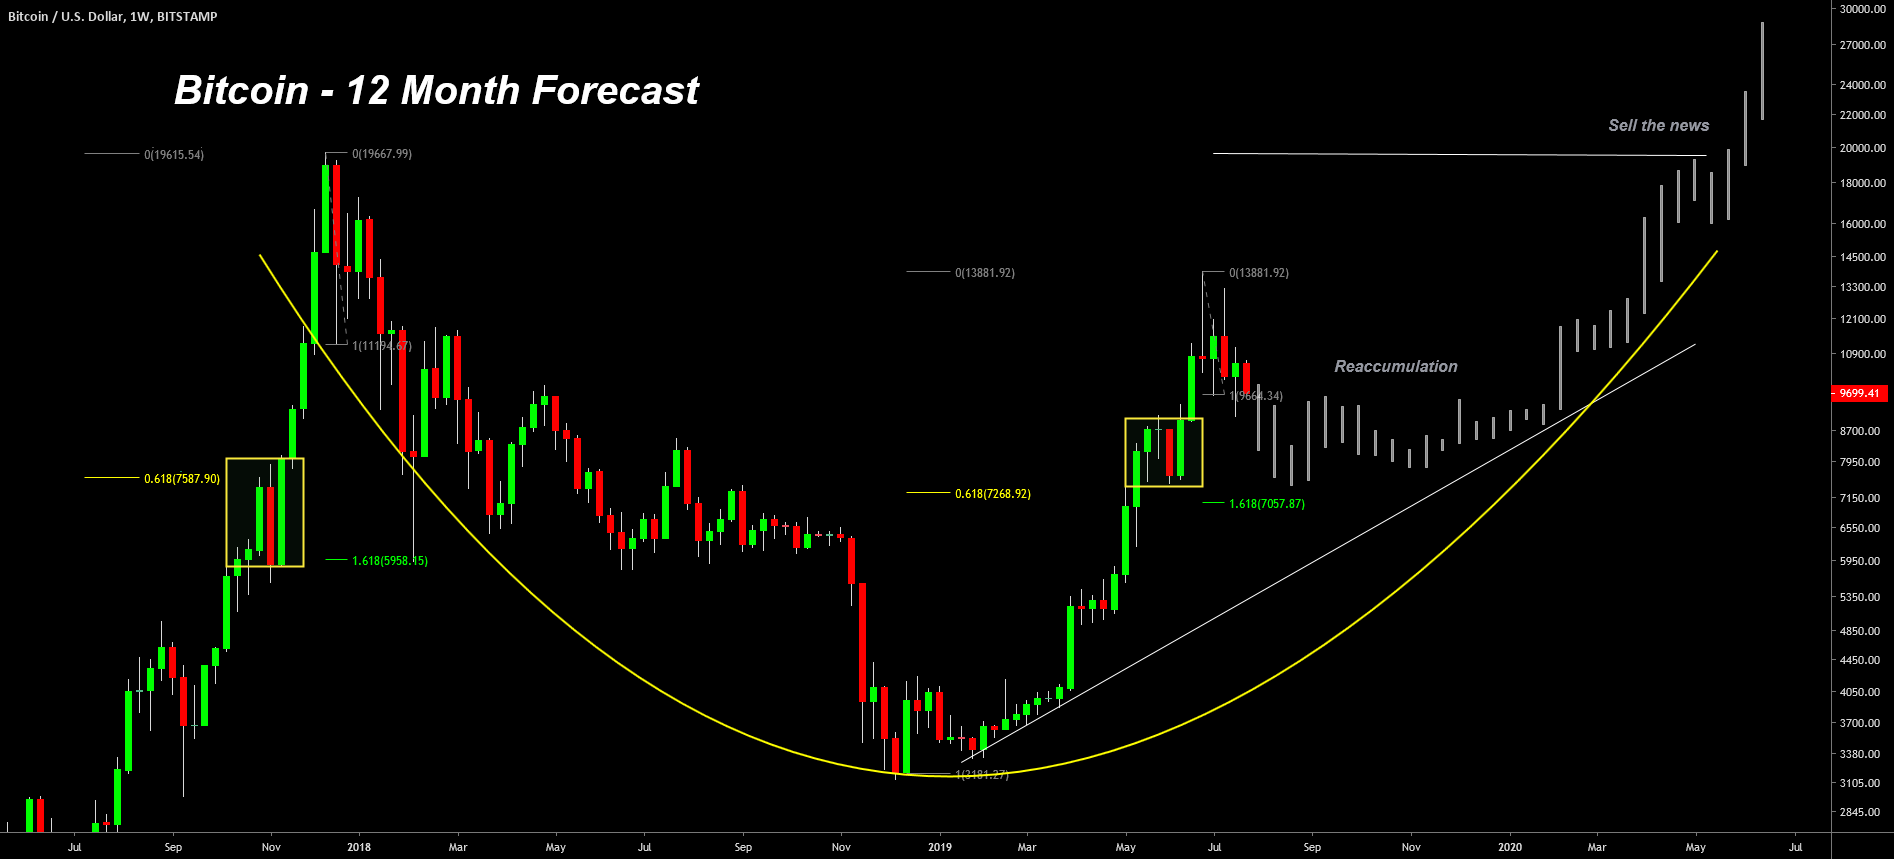
So, firstly as you know there have been two scenarios which I have been pushing around for many months – the Miners Bottom and the 12 Month forecast – the two combined made me conclude to certainty of 75% that there would not be a significant retracement back to new lows or into the 5,000s and what we were seeing was a period of accumulation.
As I’m sure you have already gathered, I am still of this view, although I would go as far as saying with 80% certainty that I think the bottom is now in for bitcoin and we are going to play out the 12 Month forecast. One issue with the miners bottom is that there is not an absolute given in terms of what the bottom is and what it is for one, is not necessarily the same for another. I theorized initially we would be between $6.5k and $7.5k and so I’m satisfied we have played this scenario out but still maintain that there will be selling pressure while we are at prices today which are up towards $10k.
So what’s new with the 12 Month forecast? When I initially did this obviously I got the breakdown timing a little off and now we know what happened. The thought process was that we would break down, test the 61.8% and then rocket back up to the resistance at $9.5k, so now we have that I think it’s likely that we will spend some time retracing back into the range from where we have come.

There are still a lot of bears out there and we have only recently had the 50/200 cross. If you recall, in the edition last week I mentioned to you about the Daily moving average death cross and how I thought we would rally into it – well that’s what we got in a round-a-bout way (although I probably need to thank president Xi Jinping for that). Typically after the death cross rally, we do get some bearish momentum.
So the 12 month forecast is the one I think we need to continue to focus on moving forwards. While everyone is looking at the daily death cross, they are ignoring the weekly 50/100 averages which are due to cross at the start of December. The resistance we saw as BTC briefly broke $10k was significant and the current chart looks nasty – I tried to long it and regretted it and was stopped out ion the stop run yesterday.
The ‘working week bears’ have kept the weekend price action in check and It doesn’t look to me like there will be momentum to break through $9.5k with ease. $9.5k is textbook shorting territory at previous support now resistance and although resistance is there to be broken, its looking increasingly difficult.
Should we get the retracement that I am hypothesizing, I expect it to be into the mid $8ks and fill the CME meme gap (which is incredibly annoying but I suspect is destined to occur
You can actually see that ever since CME came back online, there has been one direction of travel and unfortunately the Gap fill has simply become a self-fulfilling prophecy. So a retracement there and quite possibly beyond seems highly likely;- there will be all sorts of fomo margin longs that went into the books when we had the run up and a waterfall cascade down seems logical. I’m looking at $8.5k as an area of interest.
50/100 MA Cross
The 50/100 Week moving average is due to cross going into December. I could see us ranging into the existing channel until we get to the end of the year when this narrative picks up and we start moving towards the upside once again. There will be 6 months to go before the halving and the narrative will no doubt gain momentum as we go towards it.
As you can see, this cross has happened before the previous halving and was accompanied by a huge kick to the upside. I continue to maintain that we will see a move towards all-time highs faster than we saw in previous halving, due to better information out in the market place such as the Stock to flow model and because we already know that Litecoin moved earlier than in previous cycles when it had its halving.
When we break resistance
So as im speculating that we will take some time to break $9.5k, I actually think when we do, its possible, if not likely that we will burn straight through the range above. This will be due to a tremendous short squeeze that we will have created with shorts from 9.5k and those which are still active from above that. This action and momentum should give us the fuel to full move into the new cycle ahead of the halving and take on the All-time high.
A friendly reminder that this is just my macro view and could be invalidated if we break $9.5k and start ranging above that for a couple of months. I still think it is highly unlikely that $6.5k would be breached and to be more specific I doubt the 61.8% will be breached; these big memorable reactions in Bitcoin moves are usually definitive.
If you liked this post, would appreciate you leaving a like!
Cheers.
Filb
So I wanted to bring you my thoughts as to what’s occurring given that we have had such a defining move.
So, firstly as you know there have been two scenarios which I have been pushing around for many months – the Miners Bottom and the 12 Month forecast – the two combined made me conclude to certainty of 75% that there would not be a significant retracement back to new lows or into the 5,000s and what we were seeing was a period of accumulation.
As I’m sure you have already gathered, I am still of this view, although I would go as far as saying with 80% certainty that I think the bottom is now in for bitcoin and we are going to play out the 12 Month forecast. One issue with the miners bottom is that there is not an absolute given in terms of what the bottom is and what it is for one, is not necessarily the same for another. I theorized initially we would be between $6.5k and $7.5k and so I’m satisfied we have played this scenario out but still maintain that there will be selling pressure while we are at prices today which are up towards $10k.
So what’s new with the 12 Month forecast? When I initially did this obviously I got the breakdown timing a little off and now we know what happened. The thought process was that we would break down, test the 61.8% and then rocket back up to the resistance at $9.5k, so now we have that I think it’s likely that we will spend some time retracing back into the range from where we have come.
There are still a lot of bears out there and we have only recently had the 50/200 cross. If you recall, in the edition last week I mentioned to you about the Daily moving average death cross and how I thought we would rally into it – well that’s what we got in a round-a-bout way (although I probably need to thank president Xi Jinping for that). Typically after the death cross rally, we do get some bearish momentum.
So the 12 month forecast is the one I think we need to continue to focus on moving forwards. While everyone is looking at the daily death cross, they are ignoring the weekly 50/100 averages which are due to cross at the start of December. The resistance we saw as BTC briefly broke $10k was significant and the current chart looks nasty – I tried to long it and regretted it and was stopped out ion the stop run yesterday.
The ‘working week bears’ have kept the weekend price action in check and It doesn’t look to me like there will be momentum to break through $9.5k with ease. $9.5k is textbook shorting territory at previous support now resistance and although resistance is there to be broken, its looking increasingly difficult.
Should we get the retracement that I am hypothesizing, I expect it to be into the mid $8ks and fill the CME meme gap (which is incredibly annoying but I suspect is destined to occur
You can actually see that ever since CME came back online, there has been one direction of travel and unfortunately the Gap fill has simply become a self-fulfilling prophecy. So a retracement there and quite possibly beyond seems highly likely;- there will be all sorts of fomo margin longs that went into the books when we had the run up and a waterfall cascade down seems logical. I’m looking at $8.5k as an area of interest.
50/100 MA Cross
The 50/100 Week moving average is due to cross going into December. I could see us ranging into the existing channel until we get to the end of the year when this narrative picks up and we start moving towards the upside once again. There will be 6 months to go before the halving and the narrative will no doubt gain momentum as we go towards it.
As you can see, this cross has happened before the previous halving and was accompanied by a huge kick to the upside. I continue to maintain that we will see a move towards all-time highs faster than we saw in previous halving, due to better information out in the market place such as the Stock to flow model and because we already know that Litecoin moved earlier than in previous cycles when it had its halving.
When we break resistance
So as im speculating that we will take some time to break $9.5k, I actually think when we do, its possible, if not likely that we will burn straight through the range above. This will be due to a tremendous short squeeze that we will have created with shorts from 9.5k and those which are still active from above that. This action and momentum should give us the fuel to full move into the new cycle ahead of the halving and take on the All-time high.
A friendly reminder that this is just my macro view and could be invalidated if we break $9.5k and start ranging above that for a couple of months. I still think it is highly unlikely that $6.5k would be breached and to be more specific I doubt the 61.8% will be breached; these big memorable reactions in Bitcoin moves are usually definitive.
If you liked this post, would appreciate you leaving a like!
Cheers.
Filb
تعليق:

تعليق:

تعليق:

تعليق:

تعليق:

تعليق:
Update on Forecast
As it has been a little while since I published the updated 12 month forecast, I thought It would be useful to give an update as to where we are and if anything has changed.
Overall, as we expected, on a macro level, the ~$9500 critical weekly resistance level held as resistance and Bitcoin continues a slow bleed back along the trajectory which was forecast with an impending 50/100 week moving average bullish cross.
All this is within the expectation of the model, but in an ideal world, we should have seen Bitcoin make more of a gallant effort to retest that level this week or in the next couple of weeks. The Ghost bars which I have demonstrated on the chart are those from the 2018/9 bottom and as such serve to help us understand what type of price action a bottom may look like but does not necessarily dictate exactly how it should play out.
Daily Chart
The Daily chart is quite useful in setting the scene with the existing price action as we can see the 100 DMA is holding price down at weekly resistance, the 200 DMA which was previous support, has once again turned to resistance and we now have the 50 DMA acting as support. Price is showing some signs of trending into a falling wedge at present and may imply that there could be the bounce I would like to see, if it can hold onto the 50 as support but as it stands the price action is decisively bearish and is reminiscent of that which was seen prior to the fall from $10k.
A little way below the 50 DMA, at $7.9k, lies the recent point of control which is where most volume has been traded at a given price. This is also around where the 100 weekly moving average lies and as such is a critical level in my view which must hold or at least see some reaction if it is retested. There is a fairly sizable VPVR gap below that and Bitcoin has never closed below the 100 WMA in a bull market, in fact losing that level historically has resulted in capitulation as you can see in the chart below.
تعليق:
The Importance of the 100 WMA
Looking closer at the previous bottom in 2018/19, we can see that there was a decisively more bearish outlook by the market in that the funding rates were negative. Funding rates are important as they serve to keep derivative markets in check by punishing those who are overly zealously pushing price away from the spot price and can help dictate if sentiment is overly leveraged against the market prices. We know that there is a correlation between negative funding and a reversal in price so this is somewhat indicatively bearish at the moment.
Fractal comparison
Ultimately Bitcoin ended up bottoming out at the 78.6% retracement level which is coincidently the same point of control level mentioned earlier, just shy of $8k. I will be a buyer at this level and looking to take on risk at this point. Should this level be reached, it is evidently crucial; those who missed the absolute bottom in 2018 ultimately propped up the market later in 2019 and today, similarly, we had the c.40% bounce off the 61.8% retracement off the back of the China is embracing blockchain tech (not Bitcoin I will add!).
Early positive signs to watch for here will be double bottoming in price action and divergences in RSI and mac-d but most ideally I would love to see an OBV bullish divergence again on the 4 hour chart and a loaded bid side which was also a factor earlier this year.
CME
The Commodities Futures Trading Commission (CFTC who regulate the CME, issue a Commitment of Traders (COT) report Friday which ultimately reveals the net position of Retail, Pro and Institution market participants. As it stands, we can see that retail remain bullish, that pros are now net bullish and that the institutions are decisively bearish. Again, in line with the thought earlier, the fact that retail are still bullish is of concern, but the pros and retail got it right at the bottom in 2018 and the institutions did not which is a silver lining. I will point out that the institutions are as exposed short as they have previously had the interest to do so, so there is a potential that they might be close to reaching their risk appetite, but that is pure speculation.
Its also worth noting that the CME chart which largely omits weekend data looks decisively more bearish – we have closed the gap which I mentioned last week but the important take away here is that the 200 DMA came to the rescue when we had the breakdown in the last week of October. I certainly think the CME chart is getting overlooked to a large extent, but given that we are looking at it now, I will point out that the 200 DMA will be sat at $7900 on the weekly chart where we can also see their $78.6% retracement is also in confluence. I say their chart, because it misses the Friday night price action out which took bitcoin over $10.4k.
Therefore all things considered and looking at the price alone, $8k is a key level to watch;- we may bounce higher which would be fine, but as it currently stands it appears to be acting as a magnet of some sort. If history is anything to go off we should be able to wait for this level and gain some clear indication in volume and momentum divergences as well as sentiment that the time will have come to look to take on long positions; although I am still confident in this forecast, we are not in a hurry and the market should indicate when the time is right to fill the bags.
FREE Telegram Channel ⏩⏩⏩ t.me/cryptotraider
GET MY INDICATORS; www.decentrader.com/?ref=51
Follow on Twitter @filbfilb
GET MY INDICATORS; www.decentrader.com/?ref=51
Follow on Twitter @filbfilb