Morning guys,
Today's analysis is a bit more sophisticated because we have to consider more scenarios for the market and specify criteria of direction.
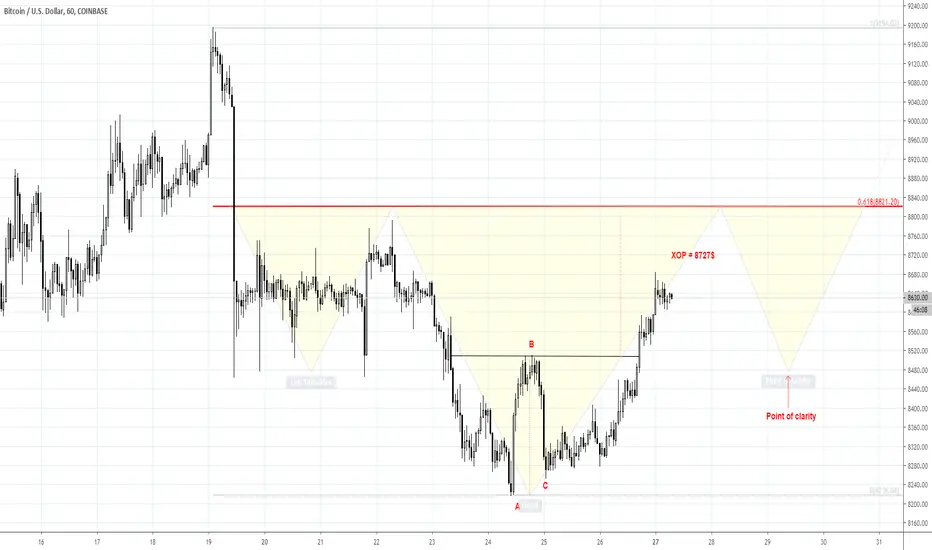
Our first step is done perfectly. BTC indeed has reached predefined Confluence support area and turned up from it. Now, we have two patterns for estimation upside target. First is AB-CD pattern, which points on 8727$ target
and Double Bottom shape which, in turn, suggests that target should be in Agreement with major 5/8 resistance around 8.8K. It means that most probable destination point is the range between these two targets.
Next stage should follow down as we just can't miss obvious H&S shape here. Besides 8.8K area is potential neckline of the pattern. Supposedly the right arm bottom should be around 8.5K$. And this will be "Point of clarity" as I call it.
Because this is invalidation point for H&S. If market will break it down - be prepared to drop below the "head" and larger downside AB=CD on 4H chart.
If market will hold there, I mean around 8.5K - upward action will be re-established, at least BTC has to challenge daily resistance again of 9-9.5K area.
Plan your trade accordingly. For instance, to make long entry consider 8.5K - the bottom of the right arm. Bears could think either on neckline resistance or on stop "Sell" order somewhere below right arm but above the Head bottom.
Today's analysis is a bit more sophisticated because we have to consider more scenarios for the market and specify criteria of direction.
Our first step is done perfectly. BTC indeed has reached predefined Confluence support area and turned up from it. Now, we have two patterns for estimation upside target. First is AB-CD pattern, which points on 8727$ target
and Double Bottom shape which, in turn, suggests that target should be in Agreement with major 5/8 resistance around 8.8K. It means that most probable destination point is the range between these two targets.
Next stage should follow down as we just can't miss obvious H&S shape here. Besides 8.8K area is potential neckline of the pattern. Supposedly the right arm bottom should be around 8.5K$. And this will be "Point of clarity" as I call it.
Because this is invalidation point for H&S. If market will break it down - be prepared to drop below the "head" and larger downside AB=CD on 4H chart.
If market will hold there, I mean around 8.5K - upward action will be re-established, at least BTC has to challenge daily resistance again of 9-9.5K area.
Plan your trade accordingly. For instance, to make long entry consider 8.5K - the bottom of the right arm. Bears could think either on neckline resistance or on stop "Sell" order somewhere below right arm but above the Head bottom.
ForexPeaceArmy BTC analytics :
forexpeacearmy.com/r/author/11/sive-morten-blog
FX, GOLD:
forexpeacearmy.com/community/forums/sive-morten-currencies-and-gold-video-analysis.122/
forexpeacearmy.com/r/author/11/sive-morten-blog
FX, GOLD:
forexpeacearmy.com/community/forums/sive-morten-currencies-and-gold-video-analysis.122/
إخلاء المسؤولية
لا يُقصد بالمعلومات والمنشورات أن تكون، أو تشكل، أي نصيحة مالية أو استثمارية أو تجارية أو أنواع أخرى من النصائح أو التوصيات المقدمة أو المعتمدة من TradingView. اقرأ المزيد في شروط الاستخدام.