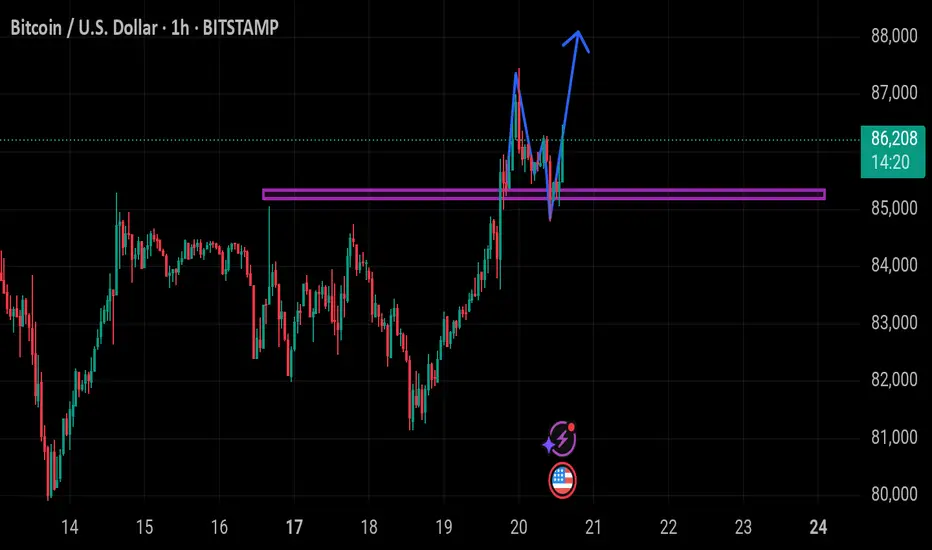
This is a Bitcoin (BTC/USD) price chart on the 1-hour timeframe from TradingView. The price is currently at $86,278, down -0.68%.
Key Observations:
1. Support Zone (Purple Line): A strong horizontal support/resistance level is drawn around $85,000.
2. Breakout & Retest: The price recently broke above this support zone, retested it, and bounced back up.
3. Bullish Projection (Blue Arrow): A potential bullish move is indicated, suggesting further upside momentum.
This chart suggests a possible continuation of the uptrend if the support holds. Let me know if you need further analysis!
إخلاء المسؤولية
لا يُقصد بالمعلومات والمنشورات أن تكون، أو تشكل، أي نصيحة مالية أو استثمارية أو تجارية أو أنواع أخرى من النصائح أو التوصيات المقدمة أو المعتمدة من TradingView. اقرأ المزيد في شروط الاستخدام.
إخلاء المسؤولية
لا يُقصد بالمعلومات والمنشورات أن تكون، أو تشكل، أي نصيحة مالية أو استثمارية أو تجارية أو أنواع أخرى من النصائح أو التوصيات المقدمة أو المعتمدة من TradingView. اقرأ المزيد في شروط الاستخدام.