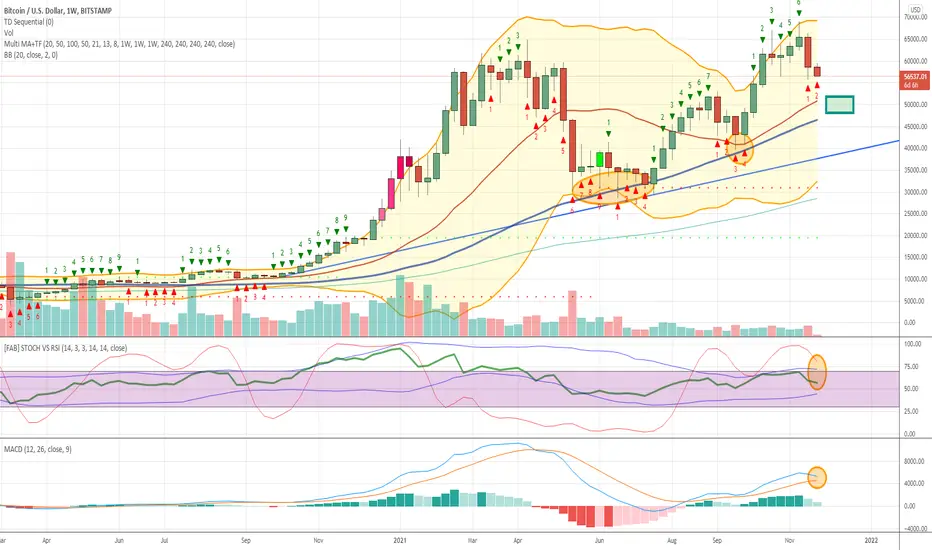
Flat volume, nervous PA and vanishing momentum.
A test of middle of weekly BB wouldn't surprise me.
51k is the pivotal area, but a slump / flash crash may hit anywhere from 52k to 47k.
Anyway, technically i foresee a further test of either long term MAs (see dark blue and red lines).
If such test fails, red light under 43k.
BTW: A big thanks to my supporters, sorry for the long hiatus due to unforeseen circumstances (some health issues). Will try to update.
ملاحظة
Given the above weekly picture, it's worth taking a look to shorter timeframe.Here is daily:
It's worth mentioning the red TD count 9, which usally anticipates a pause/sideways (and continuation) or a bounce/reversal. Given RSI is still quite far from oversold (that's it, since july) i'd speculate a slump or an ephemeral *technical* bounce are the viable options from here.
In the latter case price would find resistance within the 62-64k area, at risk of a H&S confirmation. Hence i would avoid any risks, short term, accordingly to the weekly scenario.
ملاحظة
12H hints possible bounce incoming.ملاحظة
Bouncing, indeed.As i wrote above man resistance area is 62k to 64k, provided bulls have enough steam to get there.
The overall weekly TF scenario is unchanged: i'd consider current move technical and ephemeral, unless price manages to push over 64k on a daily close.
That would invalidate this analysis, eventually.
ملاحظة
Less than 2 weeks later our target box was matched, confirming the analysis.We got some weak technical ephemeral bounce failing to even nail 60k and a due flash crash.
The latter hit 42k area and test of MAs ongoing: awaiting weekly close for due confirmation.
As i wrote in OP, a confirmed failure of blue MA test on CLOSE would be concerning and a loss of 43k dangerous.
We already had a strong spike down, let's see what kind of reaction we get.
I guess today many people are desperately looking for some news justifying this flashcrash, as usual.
No need to look there, no need to hurry. Especially now, as it's late.
Causes of this drop reside in the price action dating back to mid-november.
This is profit taking, so let's accept it.
Moreover at least six indicators warned about some "impulsive move down" (as per title) coming.
This is from a comment about a week ago.
See that divergence and the black notes:
So, this was predicted because it was predictable.
What was uncertain was the exact timing.
Now let's see close and eyes on alts.
ملاحظة
Picture as of today, price trapped between MA50/W and MA20/W, right in the middle of the area proposed in the opening post.Awaiting weekly close: if support holds a bounce and some sideways action may happen. Resistance close to 52k mark.
ملاحظة
Support did hold and as expected we get a bounce.It may be a mere poullback though, so watch resistance trendline as there is a fair probability of rejection.
ملاحظة
Putting things in perspective, here's a long term support map:1) close to 44k marg: FIB 0.618 of whole movement up from 3k, FIB 0.382 of last leg up from 28k. This support is quite likely to be tested (again), it's a matter of time. A break would confirm a bearish trend.
2) close to 40k mark: highest static support.
3) Just above 28k: FIB 0.382 of the whole movement up, second highest static support. This is last stand, failing that i'd assume a change in overal structure of long term trend.
ملاحظة
Short term scenario update:Still range bound (MA20/W - MA50/W), awaiting weekly close again.
Yet we have a possibile bullish divergence there.
Also low TF oscillators are close to oversold.
Hence a further bounce may be in the cards, possibly stronger.
Watch MA20/W as it's resistance.
ملاحظة
Bouncingملاحظة
Well 50.800$ was a bit underwhelming for a bounce, as tthe previous one.Seems to me price is being methodically suppressed.
Still i think it has margin for a much stronger bounce, given the picture of oscillators on daily. Maybe a liquidity bath may suffice ( should be able to pick some closer to 44k mark, eventually).
Anyway, the crucial point is recovering 47700$ on weekly close.
Long way to go.
ملاحظة
MACD VXI shows a bullish crossover, unless it fakes out.Awaiting confirmation in next candles.
Anyway, we may have "the" bounce coiling.
Moreover ETH at bottom of its channel.
ملاحظة
Come on, let's do a decent breakout.ملاحظة
Failed, but still not over:ملاحظة
Short term:Most risk effective speculative entry would be within the blue box.
It may be "done" already though, hence plan B would be catching the falling wedge breakout.
ملاحظة
Challenging the bound of the falling wedge as well as MA50/W ...ملاحظة
ملاحظة
ملاحظة
Needs 50,3k in order to reverse daily Parabolic SAR.If that happens 52,2k and 53k may have a chance.
Let's see and eyes on alts.
ملاحظة
Breakout of the descending broadening wedge, with Parabolic SAR reversal:ملاحظة
52,1k reached. Not much impressive, back to the point.
Let's see the rest of the week, we have EOY and futures expiration.
Then we'll better judge.
إخلاء المسؤولية
لا يُقصد بالمعلومات والمنشورات أن تكون، أو تشكل، أي نصيحة مالية أو استثمارية أو تجارية أو أنواع أخرى من النصائح أو التوصيات المقدمة أو المعتمدة من TradingView. اقرأ المزيد في شروط الاستخدام.
إخلاء المسؤولية
لا يُقصد بالمعلومات والمنشورات أن تكون، أو تشكل، أي نصيحة مالية أو استثمارية أو تجارية أو أنواع أخرى من النصائح أو التوصيات المقدمة أو المعتمدة من TradingView. اقرأ المزيد في شروط الاستخدام.