Intro
Today I want to approach the market from the top down — starting with the higher timeframes and gradually moving lower — to refresh my overall outlook. Ideally, I’d do this after each weekly candle close, but I’ve decided to try it today as part of my decision-making process.
I generally prefer to react to the market rather than predict it, but in order to prepare my reactions ahead of time, I want to see whether Bitcoin shows any signs of correction in the weekly timeframe. Of course, September’s fundamental events could heavily influence market direction, but for now, I’ll stick to the technical picture.
1️⃣ Weekly Timeframe

The weekly chart clearly shows Bitcoin in a strong uptrend. Price remains above the rising trendline, consistently printing higher highs and higher lows.
* One observation: the percentage growth after each rally is slowing, but the absolute growth remains relatively constant at around $45,000 per leg. This suggests that if price rejects from the trendline again, the next potential target could be around $150,000, which also aligns with Fibonacci extensions.
So far, there are no signs of a trend reversal.
⚠️ However, according to Dow Theory, volume should confirm the trend — yet Bitcoin’s weekly volume has been declining. This is an early signal of potential weakness.
➡️ For now, the weekly structure doesn’t indicate a correction, but if the weekly trendline breaks, we’ll reassess.
2️⃣ Daily Timeframe

Currently, Bitcoin is ranging between 101,000 and 123,600. Despite the broader bullish bias, both lower highs and lower lows have appeared recently, signaling weaker bullish momentum.
* With the latest correction from 123,000 to 112,300, the price is now closer to its long-term trendline than ever before.
* We don’t yet have confirmation that the correction is finished, but there are hints:
1- Momentum on the downside has slowed. We’re even seeing the first equal high formation — if a higher low + higher high follows, that would confirm a trend shift.
2- Inflows: During the last bullish leg in the 4H chart, Bitcoin dominance also made a bullish leg, suggesting fresh money entering Bitcoin. But since dominance is still in a larger downtrend, this could just be a corrective bounce.
📌 With today’s important news release, if data favors crypto, we could see a continuation to the upside. If not, I expect Bitcoin to revisit its long-term trendline first before deciding the next move.
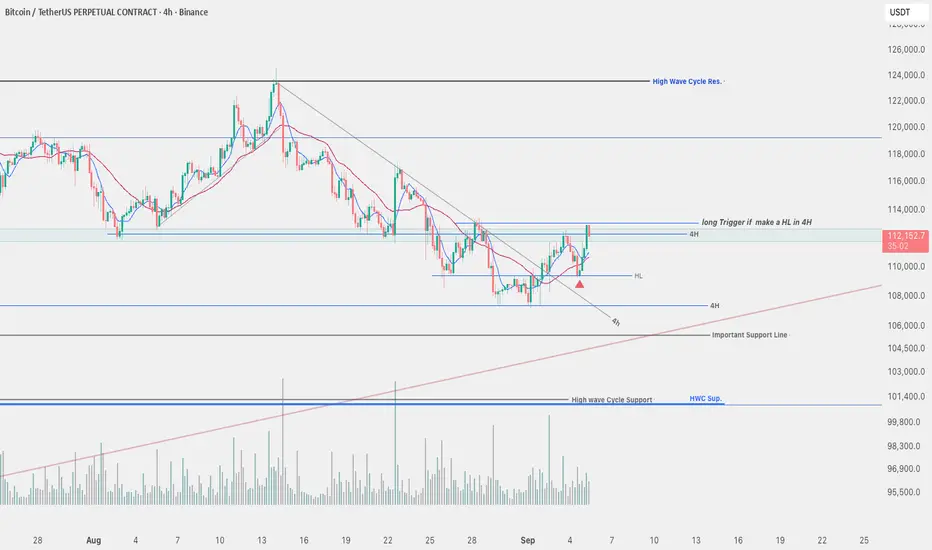
3️⃣ 4H Timeframe
The daily correction looks like a clean descending trend on the 4H chart, with clear lower highs and lower lows.
* This channel has now been broken.
* A higher low has already formed.
➡️ If today’s long trigger breaks, it could be a good long opportunity provided BTC dominance rises alongside Bitcoin.
Otherwise, it may be more reasonable to look for long setups in altcoins.
Today I want to approach the market from the top down — starting with the higher timeframes and gradually moving lower — to refresh my overall outlook. Ideally, I’d do this after each weekly candle close, but I’ve decided to try it today as part of my decision-making process.
I generally prefer to react to the market rather than predict it, but in order to prepare my reactions ahead of time, I want to see whether Bitcoin shows any signs of correction in the weekly timeframe. Of course, September’s fundamental events could heavily influence market direction, but for now, I’ll stick to the technical picture.
1️⃣ Weekly Timeframe
The weekly chart clearly shows Bitcoin in a strong uptrend. Price remains above the rising trendline, consistently printing higher highs and higher lows.
* One observation: the percentage growth after each rally is slowing, but the absolute growth remains relatively constant at around $45,000 per leg. This suggests that if price rejects from the trendline again, the next potential target could be around $150,000, which also aligns with Fibonacci extensions.
So far, there are no signs of a trend reversal.
⚠️ However, according to Dow Theory, volume should confirm the trend — yet Bitcoin’s weekly volume has been declining. This is an early signal of potential weakness.
➡️ For now, the weekly structure doesn’t indicate a correction, but if the weekly trendline breaks, we’ll reassess.
2️⃣ Daily Timeframe
Currently, Bitcoin is ranging between 101,000 and 123,600. Despite the broader bullish bias, both lower highs and lower lows have appeared recently, signaling weaker bullish momentum.
* With the latest correction from 123,000 to 112,300, the price is now closer to its long-term trendline than ever before.
* We don’t yet have confirmation that the correction is finished, but there are hints:
1- Momentum on the downside has slowed. We’re even seeing the first equal high formation — if a higher low + higher high follows, that would confirm a trend shift.
2- Inflows: During the last bullish leg in the 4H chart, Bitcoin dominance also made a bullish leg, suggesting fresh money entering Bitcoin. But since dominance is still in a larger downtrend, this could just be a corrective bounce.
📌 With today’s important news release, if data favors crypto, we could see a continuation to the upside. If not, I expect Bitcoin to revisit its long-term trendline first before deciding the next move.
3️⃣ 4H Timeframe
The daily correction looks like a clean descending trend on the 4H chart, with clear lower highs and lower lows.
* This channel has now been broken.
* A higher low has already formed.
➡️ If today’s long trigger breaks, it could be a good long opportunity provided BTC dominance rises alongside Bitcoin.
Otherwise, it may be more reasonable to look for long setups in altcoins.
إخلاء المسؤولية
لا يُقصد بالمعلومات والمنشورات أن تكون، أو تشكل، أي نصيحة مالية أو استثمارية أو تجارية أو أنواع أخرى من النصائح أو التوصيات المقدمة أو المعتمدة من TradingView. اقرأ المزيد في شروط الاستخدام.
إخلاء المسؤولية
لا يُقصد بالمعلومات والمنشورات أن تكون، أو تشكل، أي نصيحة مالية أو استثمارية أو تجارية أو أنواع أخرى من النصائح أو التوصيات المقدمة أو المعتمدة من TradingView. اقرأ المزيد في شروط الاستخدام.