₿ BITCOIN: Multi-Phase Correction Scenario - Liquidity Hunt to Major Pullback
Sharing my broader outlook for Bitcoin's next major moves. This is a multi-timeframe analysis with several key phases. 🎯
**📍 Phase 1: Daily Dow Theory Reversal**
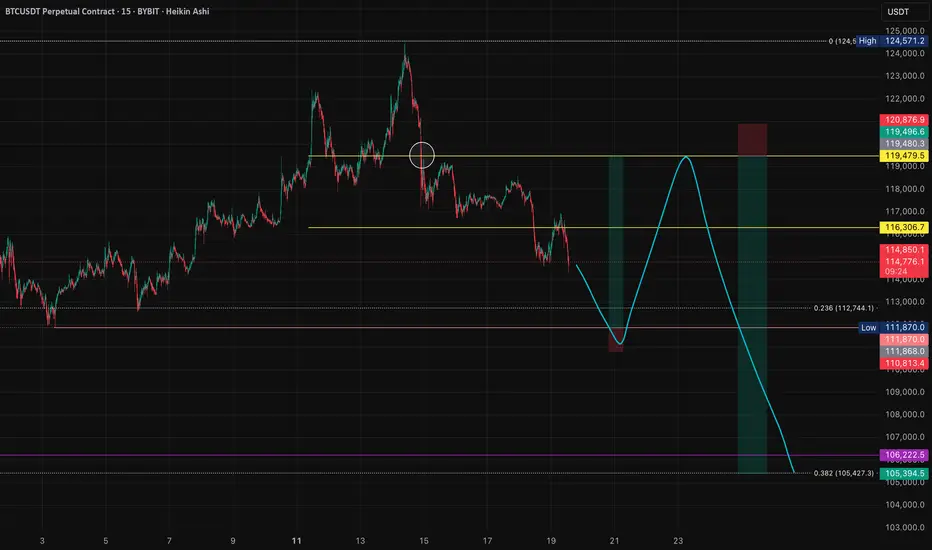
The pink line below marks the daily timeframe pivot point based on Dow Theory. I'm expecting a liquidity grab at this level first - sweeping out the stop losses parked below this key structural point. 🔄
**📈 Phase 2: The Counter-Trend Rally**
After the liquidity hunt, I'm looking for a recovery back toward the upper yellow horizontal line - this represents the recent range high. This would be a classic "fake-out" move to trap short-biased traders before the real decline begins. 🎭
**⏰ Time Factor Consideration:**
If this rally extends into next week or beyond, we might only see a recovery to the lower yellow horizontal line instead. **Time affects momentum** - the longer price takes to develop, the weaker the eventual bounce tends to be. 📅
**📉 Phase 3: The Main Event**
Finally, I'm anticipating a significant decline down to the purple line at the bottom - approximately the 0.382 Fibonacci level. This would represent the major corrective move. 🎯
**⚠️ Risk Management Note:**
I cannot provide a risk-to-reward ratio for this setup yet. **Why?** Because I don't know exactly how price will behave at each critical level, and the stop loss placement will depend on how the structure develops. The R/R calculation will determine whether I actually take this trade or pass on it. 📊
**🧠 Key Takeaway:**
This is a perfect example of why having a plan is different from having a trade. I know what I want to see, but I won't commit capital until the risk-to-reward makes sense. Patience pays in trading. ⏳
---
**Trading is simple.** You don't need multiple indicators or dozens of lines on your chart. A clean and simple chart often works best — it keeps your decisions consistent and reduces uncertainty. Sure, it might not look flashy, and my analysis may seem a bit "plain" compared to others… but that's how I like it. If you find this analysis useful, feel free to follow me for more updates.
---
*Disclaimer: This post is for general informational and educational purposes only. It does not constitute financial advice, investment recommendation, or a service targeting specific investors, and should not be considered illegal or restricted information in any jurisdiction.*
Sharing my broader outlook for Bitcoin's next major moves. This is a multi-timeframe analysis with several key phases. 🎯
**📍 Phase 1: Daily Dow Theory Reversal**
The pink line below marks the daily timeframe pivot point based on Dow Theory. I'm expecting a liquidity grab at this level first - sweeping out the stop losses parked below this key structural point. 🔄
**📈 Phase 2: The Counter-Trend Rally**
After the liquidity hunt, I'm looking for a recovery back toward the upper yellow horizontal line - this represents the recent range high. This would be a classic "fake-out" move to trap short-biased traders before the real decline begins. 🎭
**⏰ Time Factor Consideration:**
If this rally extends into next week or beyond, we might only see a recovery to the lower yellow horizontal line instead. **Time affects momentum** - the longer price takes to develop, the weaker the eventual bounce tends to be. 📅
**📉 Phase 3: The Main Event**
Finally, I'm anticipating a significant decline down to the purple line at the bottom - approximately the 0.382 Fibonacci level. This would represent the major corrective move. 🎯
**⚠️ Risk Management Note:**
I cannot provide a risk-to-reward ratio for this setup yet. **Why?** Because I don't know exactly how price will behave at each critical level, and the stop loss placement will depend on how the structure develops. The R/R calculation will determine whether I actually take this trade or pass on it. 📊
**🧠 Key Takeaway:**
This is a perfect example of why having a plan is different from having a trade. I know what I want to see, but I won't commit capital until the risk-to-reward makes sense. Patience pays in trading. ⏳
---
**Trading is simple.** You don't need multiple indicators or dozens of lines on your chart. A clean and simple chart often works best — it keeps your decisions consistent and reduces uncertainty. Sure, it might not look flashy, and my analysis may seem a bit "plain" compared to others… but that's how I like it. If you find this analysis useful, feel free to follow me for more updates.
---
*Disclaimer: This post is for general informational and educational purposes only. It does not constitute financial advice, investment recommendation, or a service targeting specific investors, and should not be considered illegal or restricted information in any jurisdiction.*
إخلاء المسؤولية
لا يُقصد بالمعلومات والمنشورات أن تكون، أو تشكل، أي نصيحة مالية أو استثمارية أو تجارية أو أنواع أخرى من النصائح أو التوصيات المقدمة أو المعتمدة من TradingView. اقرأ المزيد في شروط الاستخدام.
إخلاء المسؤولية
لا يُقصد بالمعلومات والمنشورات أن تكون، أو تشكل، أي نصيحة مالية أو استثمارية أو تجارية أو أنواع أخرى من النصائح أو التوصيات المقدمة أو المعتمدة من TradingView. اقرأ المزيد في شروط الاستخدام.