🔴 BITCOIN PRICE UPDATE – April 21, 2025
💰The D1 chart of
BTC
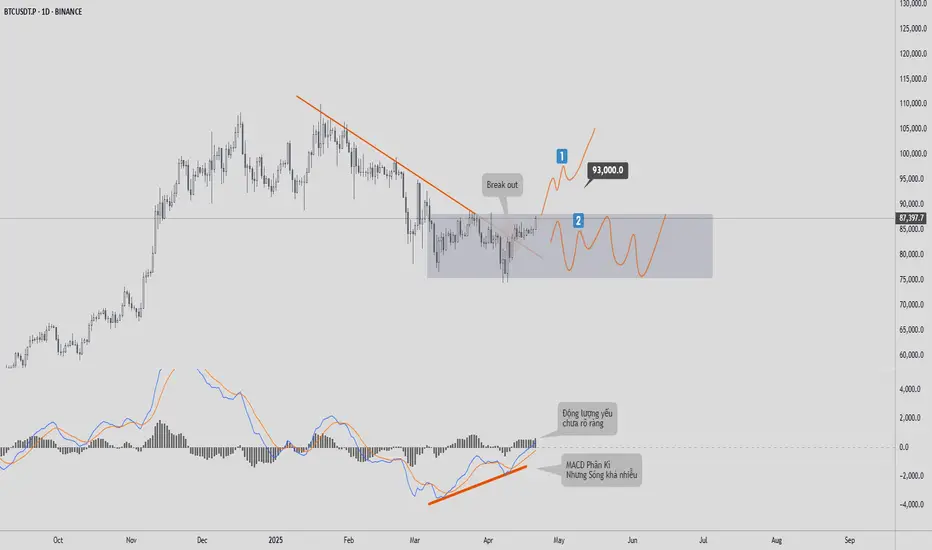
is currently showing a pretty solid buying signal. From the 78k support zone, we can see that buyers have stepped in. Although the price has broken the downtrend line and there are positive signals from the MACD, I have the following observations that you should pay close attention to before making any trading strategy decisions during this period:
1. The trendline breakout signal doesn’t necessarily indicate that the market is entering an uptrend. It could simply mean that the downtrend has temporarily ended.
2. There is a divergence signal on the MACD; however, I don’t place much weight on this, because the two lines are wrapped tightly around each other. From my experience, this signal shows more of a “PROBING” move rather than strong buyer commitment.
3. I also checked the momentum indicator, and it doesn’t show any clear bullish signals yet. This phase still doesn’t give a high-confidence indication that the market is about to reverse.
Based on these three reasons, I have two potential views for this phase:
✔️View 1: The ideal scenario is that
BTC
continues to rise toward the nearest liquidity peak (around 93k), but it would still need to pull back afterward to retest the support zone—it’s unlikely to just skyrocket without correction.
✔️View 2:
BTC
reverses at this point and forms a consolidation zone within the gray box, with price fluctuating in an 8k–10k range for the next 3 to 6 months, before making a decisive move in Q4/2025.
Personally, I lean more toward **View 2**! Because the market still lacks a clear bullish signal at this stage.
What do you think about these two scenarios? Drop a comment and let’s discuss!
💰The D1 chart of
BTC
is currently showing a pretty solid buying signal. From the 78k support zone, we can see that buyers have stepped in. Although the price has broken the downtrend line and there are positive signals from the MACD, I have the following observations that you should pay close attention to before making any trading strategy decisions during this period:
1. The trendline breakout signal doesn’t necessarily indicate that the market is entering an uptrend. It could simply mean that the downtrend has temporarily ended.
2. There is a divergence signal on the MACD; however, I don’t place much weight on this, because the two lines are wrapped tightly around each other. From my experience, this signal shows more of a “PROBING” move rather than strong buyer commitment.
3. I also checked the momentum indicator, and it doesn’t show any clear bullish signals yet. This phase still doesn’t give a high-confidence indication that the market is about to reverse.
Based on these three reasons, I have two potential views for this phase:
✔️View 1: The ideal scenario is that
BTC
continues to rise toward the nearest liquidity peak (around 93k), but it would still need to pull back afterward to retest the support zone—it’s unlikely to just skyrocket without correction.
✔️View 2:
BTC
reverses at this point and forms a consolidation zone within the gray box, with price fluctuating in an 8k–10k range for the next 3 to 6 months, before making a decisive move in Q4/2025.
Personally, I lean more toward **View 2**! Because the market still lacks a clear bullish signal at this stage.
What do you think about these two scenarios? Drop a comment and let’s discuss!
إخلاء المسؤولية
لا يُقصد بالمعلومات والمنشورات أن تكون، أو تشكل، أي نصيحة مالية أو استثمارية أو تجارية أو أنواع أخرى من النصائح أو التوصيات المقدمة أو المعتمدة من TradingView. اقرأ المزيد في شروط الاستخدام.
إخلاء المسؤولية
لا يُقصد بالمعلومات والمنشورات أن تكون، أو تشكل، أي نصيحة مالية أو استثمارية أو تجارية أو أنواع أخرى من النصائح أو التوصيات المقدمة أو المعتمدة من TradingView. اقرأ المزيد في شروط الاستخدام.