Bitcoin (BTC/USDT)
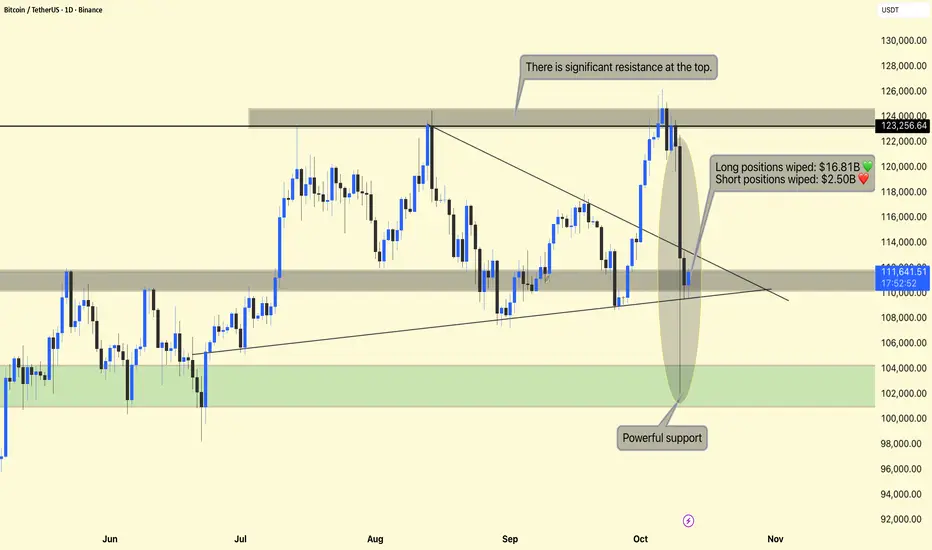
The chart shows a sharp correction from the $124,000 resistance zone, followed by a major liquidation event that wiped out:
Long positions: $16.81B
Short positions: $2.50B
This represents one of the most volatile 24-hour periods in recent months — aligning with the Fear & Greed Index drop to Extreme Fear (24).
$123,000 – $124,000 Major Resistance Strong supply area — multiple rejections in past rallies.
$111,000 – $110,000 Current Support Zone Price is currently consolidating here after the crash.
$102,000 – $104,000 Powerful Support Historical accumulation zone — where buyers previously stepped in aggressively.
Resistance Rejection
At the top of the range ($123,000–$124,000), BTC encountered heavy resistance, triggering large-scale profit-taking and the liquidation of overleveraged long positions.
This area has acted as a strong rejection zone several times since August, indicating sellers are defending it aggressively.
Breakdown and Liquidations
After the breakdown of the descending triangle, cascading liquidations forced a steep drop.
This led to a high-volume candle (highlighted area) where:
Liquidity was cleared both above and below key support levels.
Market sentiment flipped rapidly from Greed → Extreme Fear.
This kind of liquidation sweep often signals a short-term capitulation — a flush before possible recovery.
Support & Market Structure
Price bounced from near $110,000, a previous structure support level.
If BTC maintains above $110,000, it may attempt to stabilize and retest mid-range resistance around $115,000–$116,000.
However, if price breaks below $110,000, we could see a retest of the $102,000–$104,000 demand zone, which is marked as “Powerful Support” — a key area where long-term buyers might re-enter.
DYOR | NFA
منشورات ذات صلة
إخلاء المسؤولية
لا يُقصد بالمعلومات والمنشورات أن تكون، أو تشكل، أي نصيحة مالية أو استثمارية أو تجارية أو أنواع أخرى من النصائح أو التوصيات المقدمة أو المعتمدة من TradingView. اقرأ المزيد في شروط الاستخدام.
منشورات ذات صلة
إخلاء المسؤولية
لا يُقصد بالمعلومات والمنشورات أن تكون، أو تشكل، أي نصيحة مالية أو استثمارية أو تجارية أو أنواع أخرى من النصائح أو التوصيات المقدمة أو المعتمدة من TradingView. اقرأ المزيد في شروط الاستخدام.