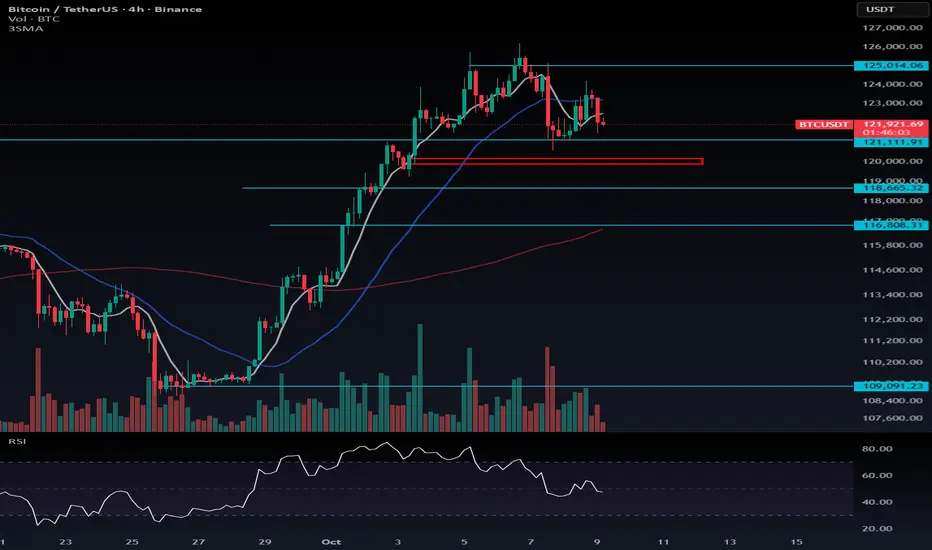
There’s a liquidity zone around $120,509, and once this level is taken out, the price could drop toward the $119,898–$120,150 range.
If Bitcoin sweeps that liquidity and then bounces back above, it would confirm the fakeout scenario I mentioned earlier — a bullish signal suggesting the continuation of the uptrend.
However, if BTC fails to recover after the sweep, the corrective move could extend further down toward the $118,665 support zone.
📉 Short Setup:
You can consider short positions if $120,111 breaks, but in my opinion, it’s better to enter slightly before the breakout, as the move could be sharp and quick.
📈 Long Setup:
The next strong long opportunity remains above $125,000.
If BTC Dominance starts printing green candles, it’s better to focus your short trades on altcoins, as they may show higher volatility and downside potential.
إخلاء المسؤولية
لا يُقصد بالمعلومات والمنشورات أن تكون، أو تشكل، أي نصيحة مالية أو استثمارية أو تجارية أو أنواع أخرى من النصائح أو التوصيات المقدمة أو المعتمدة من TradingView. اقرأ المزيد في شروط الاستخدام.
إخلاء المسؤولية
لا يُقصد بالمعلومات والمنشورات أن تكون، أو تشكل، أي نصيحة مالية أو استثمارية أو تجارية أو أنواع أخرى من النصائح أو التوصيات المقدمة أو المعتمدة من TradingView. اقرأ المزيد في شروط الاستخدام.