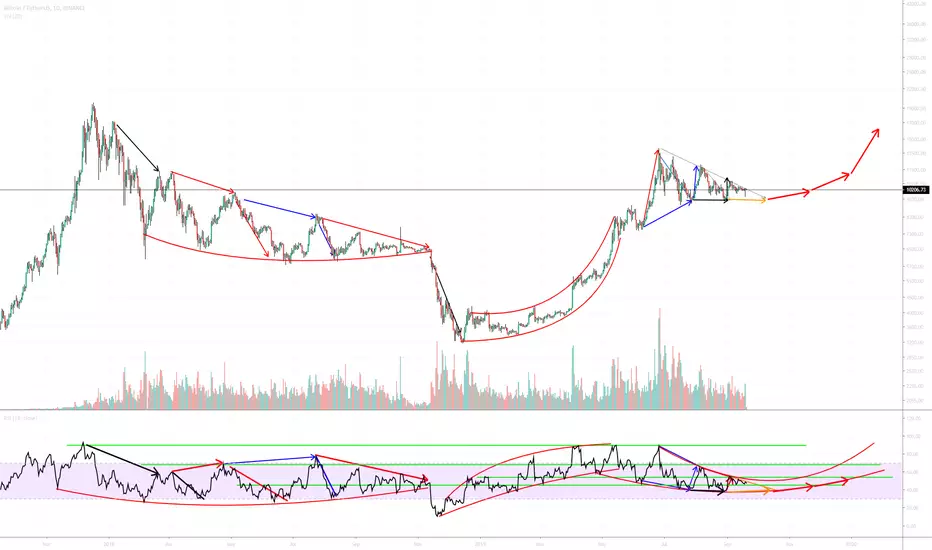
This Divergence hypothesis is just that, a HYPOTHESIS looking at the Daily RSI chart pattern and what or how it develops (not to be taken seriously).
However saying that, today, I looked at the RSI more closely and found some fluency in the pattern\s. Interesting at that.
Guessing what will come is just that, but the historical formation with both price and RSI pattern gives good insight. Its interesting and possible can help us to look at specific things as time goes by, leaving a clues as to how it will behave in the future.
For now, it doesn't help with the daily trading but I think it gives us something to keep an eye out.
Note: Moving beyond today, these red arrows indicate the bottom <<"SUPPORT" >> of the future support\resistance movement. Not the top lines.
Also NVT and RVT Ratio helps in some way to identify tops and bottoms. Right now, I believe we have more to the down side at the micro level within the formation
Looking at the RVT ratio chart, historical support level gives us a clue
charts.woobull.com/bitcoin-rvt-ratio/
RSI Daily Chart

BULLISH RSI Daily Chart Hypothesis

Cheers,
S.Sari
Previous Posts
Version 3

Version 2

Version 1

However saying that, today, I looked at the RSI more closely and found some fluency in the pattern\s. Interesting at that.
Guessing what will come is just that, but the historical formation with both price and RSI pattern gives good insight. Its interesting and possible can help us to look at specific things as time goes by, leaving a clues as to how it will behave in the future.
For now, it doesn't help with the daily trading but I think it gives us something to keep an eye out.
Note: Moving beyond today, these red arrows indicate the bottom <<"SUPPORT" >> of the future support\resistance movement. Not the top lines.
Also NVT and RVT Ratio helps in some way to identify tops and bottoms. Right now, I believe we have more to the down side at the micro level within the formation
Looking at the RVT ratio chart, historical support level gives us a clue
charts.woobull.com/bitcoin-rvt-ratio/
RSI Daily Chart
BULLISH RSI Daily Chart Hypothesis
Cheers,
S.Sari
Previous Posts
Version 3
Version 2
Version 1
Discord: discord.com/invite/vb4hbP88vb (TradeToProspa)
Telegram: t.me/TprospaTradersbot
This community has signals now but with no risk management comms.
Telegram: t.me/TprospaTradersbot
This community has signals now but with no risk management comms.
منشورات ذات صلة
إخلاء المسؤولية
لا يُقصد بالمعلومات والمنشورات أن تكون، أو تشكل، أي نصيحة مالية أو استثمارية أو تجارية أو أنواع أخرى من النصائح أو التوصيات المقدمة أو المعتمدة من TradingView. اقرأ المزيد في شروط الاستخدام.