☃️ Welcome to the cryptos winter , I hope you’ve started your day well.
❤️ I sincerely apologize to everyone in the channel — I’ve been down with a cold for several days. Now, let’s dive into the 1-hour Bitcoin analysis.
⏰ We’re analyzing BTC on the 1-Hour timeframe .
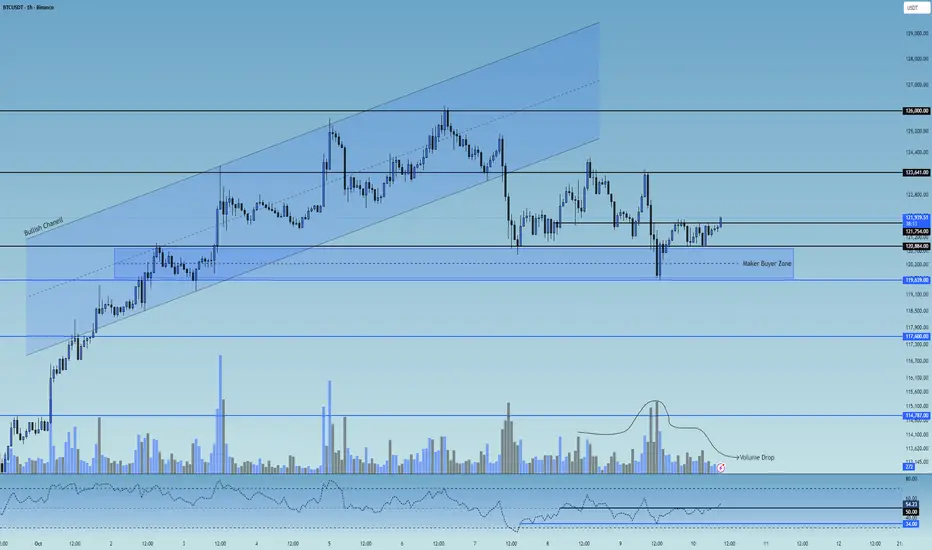
👀 In the 1-hour timeframe, after a strong bullish rally, Bitcoin broke below its ascending channel and moved toward the $121,000 support zone. From there, increased buying volume pushed the price upward, but it got rejected from the $123,600 resistance** and pulled back, creating a long trigger at that zone.
As it moved toward lower support levels, it formed a micro buyer zone between $119,640 and $120,884, where each time price enters this zone, Bitcoin experiences noticeable buying pressure.
🧮 Looking at the RSI oscillator, after ranging below the 50 level, it’s now trying to break above it. The 50 level has become a **strong static resistance, while there’s swing support near 34.
If the RSI breaks out of these marked zones, it could trigger stronger volatility and expand both **short and long trading opportunities.
🕯 The size and volume of recent candles on the 1-hour chart show range-bound movement, weak momentum, and market indecision, forming a **multi-timeframe trading range** where the top and bottom boundaries act as trigger zones.
The **micro buyer zone is where buyers aggressively defend price through market orders, preventing further downside — a reversal candle forming inside this zone is a strong example of that.
▶️ **Today’s economic news related to U.S. monetary policy can impact the market significantly. Since Bitcoin is currently in a small trading range, upcoming volatility spikes from the news could provide short-term setups.
↗️ Risky Long Scenario:
Look for a breakout above the marked $121,754 zone, accompanied by an engulfing candle, **indecision signal, SMA-7 confirmation, and increasing volume in the direction of the breakout — especially if the news comes out risk-on (positive for markets).
📉 Very Risky Short Scenario:
If price breaks below the micro buyer zone and loses the swing RSI support near 33, Bitcoin could enter a deeper correction.
However, note that a drop in Bitcoin’s price often increases its attractiveness compared to other assets, so avoid rushing into shorts.
❤️ Disclaimer : This analysis is purely based on my personal opinion and I only trade if the stated triggers are activated .
❤️ I sincerely apologize to everyone in the channel — I’ve been down with a cold for several days. Now, let’s dive into the 1-hour Bitcoin analysis.
⏰ We’re analyzing BTC on the 1-Hour timeframe .
👀 In the 1-hour timeframe, after a strong bullish rally, Bitcoin broke below its ascending channel and moved toward the $121,000 support zone. From there, increased buying volume pushed the price upward, but it got rejected from the $123,600 resistance** and pulled back, creating a long trigger at that zone.
As it moved toward lower support levels, it formed a micro buyer zone between $119,640 and $120,884, where each time price enters this zone, Bitcoin experiences noticeable buying pressure.
🧮 Looking at the RSI oscillator, after ranging below the 50 level, it’s now trying to break above it. The 50 level has become a **strong static resistance, while there’s swing support near 34.
If the RSI breaks out of these marked zones, it could trigger stronger volatility and expand both **short and long trading opportunities.
🕯 The size and volume of recent candles on the 1-hour chart show range-bound movement, weak momentum, and market indecision, forming a **multi-timeframe trading range** where the top and bottom boundaries act as trigger zones.
The **micro buyer zone is where buyers aggressively defend price through market orders, preventing further downside — a reversal candle forming inside this zone is a strong example of that.
▶️ **Today’s economic news related to U.S. monetary policy can impact the market significantly. Since Bitcoin is currently in a small trading range, upcoming volatility spikes from the news could provide short-term setups.
↗️ Risky Long Scenario:
Look for a breakout above the marked $121,754 zone, accompanied by an engulfing candle, **indecision signal, SMA-7 confirmation, and increasing volume in the direction of the breakout — especially if the news comes out risk-on (positive for markets).
📉 Very Risky Short Scenario:
If price breaks below the micro buyer zone and loses the swing RSI support near 33, Bitcoin could enter a deeper correction.
However, note that a drop in Bitcoin’s price often increases its attractiveness compared to other assets, so avoid rushing into shorts.
❤️ Disclaimer : This analysis is purely based on my personal opinion and I only trade if the stated triggers are activated .
❄️ Join the Action Now ❄️
Telegram
t.me/CryptosWinter
Mexc
promote.mexc.com/r/HHAkF63P
Bitunix
bitunix.com/register?inviteCode=28r21f
Telegram
t.me/CryptosWinter
Mexc
promote.mexc.com/r/HHAkF63P
Bitunix
bitunix.com/register?inviteCode=28r21f
منشورات ذات صلة
إخلاء المسؤولية
لا يُقصد بالمعلومات والمنشورات أن تكون، أو تشكل، أي نصيحة مالية أو استثمارية أو تجارية أو أنواع أخرى من النصائح أو التوصيات المقدمة أو المعتمدة من TradingView. اقرأ المزيد في شروط الاستخدام.