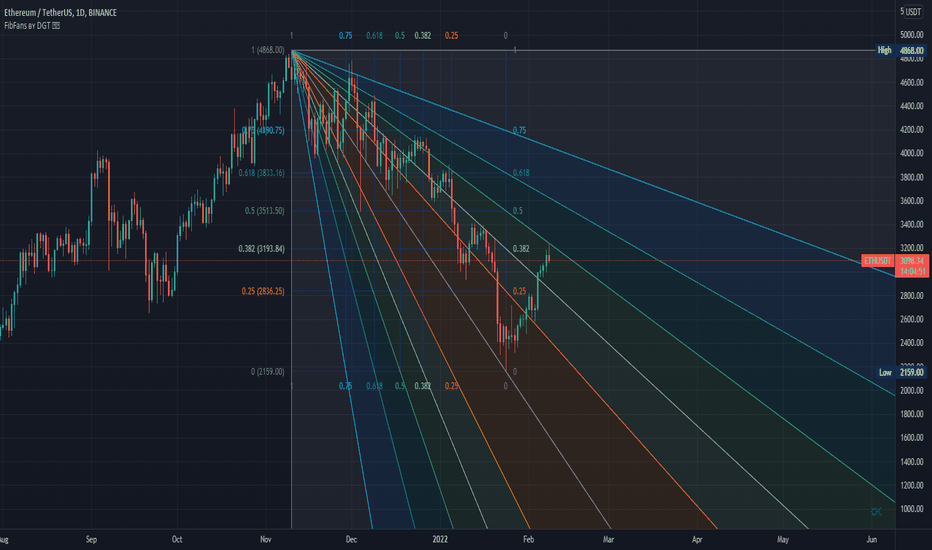
Fibonacci Speed and Resistance Fan is an analytical drawing tool used to indicate the support and resistance levels of an existing trend and the price level at which possible changes in the trend may occur.
A Fibonacci Speed Resistance Fan consists of a trend line drawn between two extreme points - a trough and opposing peak or a peak and opposing trough - on which a set of sequential speed resistance lines are drawn above (which represents time) and below (which represents price). These lines are drawn based on time/price percentages of the distance between the beginning and the end of the trend line.
Speed resistance lines not only help to measure trend corrections but also measure the speed of a trend (the rate at which a trendline ascends or descends)
Traders can use the lines of the Fibonacci Speed and Resistance Fan to predict key points of resistance or support, at which they might expect price trends to reverse. Once a trader identifies patterns within a chart, they can use those patterns to predict future price movements and future levels of support and resistance. Traders use the predictions to time their trades
Nobody appears to know whether Fibonacci tools work because markets exhibit some form of natural pattern or because many investors use Fibonacci ratios to predict price movements, making them a self-fulfilling prophecy. In any event, key support and resistance levels tend to occur frequently at the 61.8-percent level (0.618) on both uptrends and downtrends
Fibonacci Speed and Resistance Fans vs. Gann Fans
Gann fans are another form of technical analysis based on the idea that the market is geometric and cyclical in nature. A Gann fan consists of a series of trend lines called Gann angles.
Instead of relying on Fibonacci's golden ratio of 1.618, Gann believed the 45-degree angle (geometric angles of time versus price) to be most important. The Gann fan subsequently draws additional angles at 82.5, 75, 71.25, 63.75, 26.25, 18.75, 15, and 7.5 degrees. These angles are superimposed over a price chart to show potential support and resistance levels
Step By Step Applying Fibonacci Speed and Resistance Fan


Some interpretation examples:

Example of how to identify if the move is Reversal or Retracement


All the above are now available with the Auto Fibonacci Speed and Resistance Fans Study ʙʏ DGT ☼☾,


LINK to Auto Fibonacci Speed and Resistance Fans Study

A Fibonacci Speed Resistance Fan consists of a trend line drawn between two extreme points - a trough and opposing peak or a peak and opposing trough - on which a set of sequential speed resistance lines are drawn above (which represents time) and below (which represents price). These lines are drawn based on time/price percentages of the distance between the beginning and the end of the trend line.
Speed resistance lines not only help to measure trend corrections but also measure the speed of a trend (the rate at which a trendline ascends or descends)
Traders can use the lines of the Fibonacci Speed and Resistance Fan to predict key points of resistance or support, at which they might expect price trends to reverse. Once a trader identifies patterns within a chart, they can use those patterns to predict future price movements and future levels of support and resistance. Traders use the predictions to time their trades
Nobody appears to know whether Fibonacci tools work because markets exhibit some form of natural pattern or because many investors use Fibonacci ratios to predict price movements, making them a self-fulfilling prophecy. In any event, key support and resistance levels tend to occur frequently at the 61.8-percent level (0.618) on both uptrends and downtrends
Fibonacci Speed and Resistance Fans vs. Gann Fans
Gann fans are another form of technical analysis based on the idea that the market is geometric and cyclical in nature. A Gann fan consists of a series of trend lines called Gann angles.
Instead of relying on Fibonacci's golden ratio of 1.618, Gann believed the 45-degree angle (geometric angles of time versus price) to be most important. The Gann fan subsequently draws additional angles at 82.5, 75, 71.25, 63.75, 26.25, 18.75, 15, and 7.5 degrees. These angles are superimposed over a price chart to show potential support and resistance levels
Step By Step Applying Fibonacci Speed and Resistance Fan
Some interpretation examples:
Example of how to identify if the move is Reversal or Retracement
All the above are now available with the Auto Fibonacci Speed and Resistance Fans Study ʙʏ DGT ☼☾,
LINK to Auto Fibonacci Speed and Resistance Fans Study

Premium Indicators – Try Free for 15 Days: sites.google.com/view/solemare-analytics
إخلاء المسؤولية
لا يُقصد بالمعلومات والمنشورات أن تكون، أو تشكل، أي نصيحة مالية أو استثمارية أو تجارية أو أنواع أخرى من النصائح أو التوصيات المقدمة أو المعتمدة من TradingView. اقرأ المزيد في شروط الاستخدام.
Premium Indicators – Try Free for 15 Days: sites.google.com/view/solemare-analytics
إخلاء المسؤولية
لا يُقصد بالمعلومات والمنشورات أن تكون، أو تشكل، أي نصيحة مالية أو استثمارية أو تجارية أو أنواع أخرى من النصائح أو التوصيات المقدمة أو المعتمدة من TradingView. اقرأ المزيد في شروط الاستخدام.
