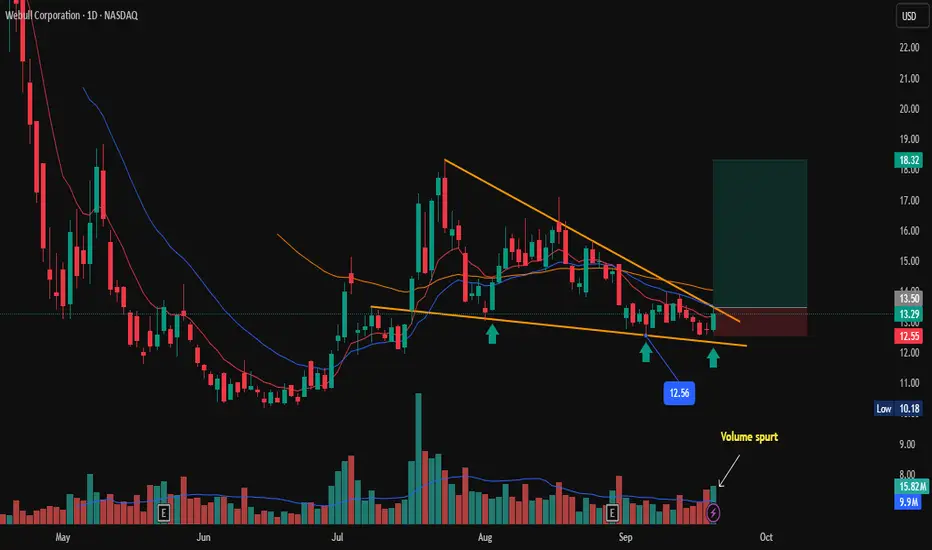
Webbull Corporation shows signs of a potential long opportunity after forming a Bullish reversal pattern (falling wedge) on the daily chart. Price respecting a trendline, and Volume spurt on last trading session. signaling Bullish momentum. hinting at a possible uptrend initiation.
Key Levels to Watch:
Immediate support at $12.56 (immediate low)
Trade Plan:
Enter long above $13.50 on confirmation of bullish candle close.
Stop loss above $12.60 to limit risk.
Target $18.00 as per falling wedge rule, or trail stop as price moves above.
Disclaimer: Risk management is crucial. so keep position sizing appropriate. This analysis is intended for educational purposes and not financial advice.
تم فتح الصفقة
Trade active SL @ costإخلاء المسؤولية
لا يُقصد بالمعلومات والمنشورات أن تكون، أو تشكل، أي نصيحة مالية أو استثمارية أو تجارية أو أنواع أخرى من النصائح أو التوصيات المقدمة أو المعتمدة من TradingView. اقرأ المزيد في شروط الاستخدام.
إخلاء المسؤولية
لا يُقصد بالمعلومات والمنشورات أن تكون، أو تشكل، أي نصيحة مالية أو استثمارية أو تجارية أو أنواع أخرى من النصائح أو التوصيات المقدمة أو المعتمدة من TradingView. اقرأ المزيد في شروط الاستخدام.