🚀 Breakout Stock Alert: Camlin Fine Sciences Ltd (CAMLINFINE)
📌 Price: ₹179.00 📊 Volume: 2.91M 📅 Date: 13-05-2025
① Pattern Name, Timeframe, Structure & Explanation
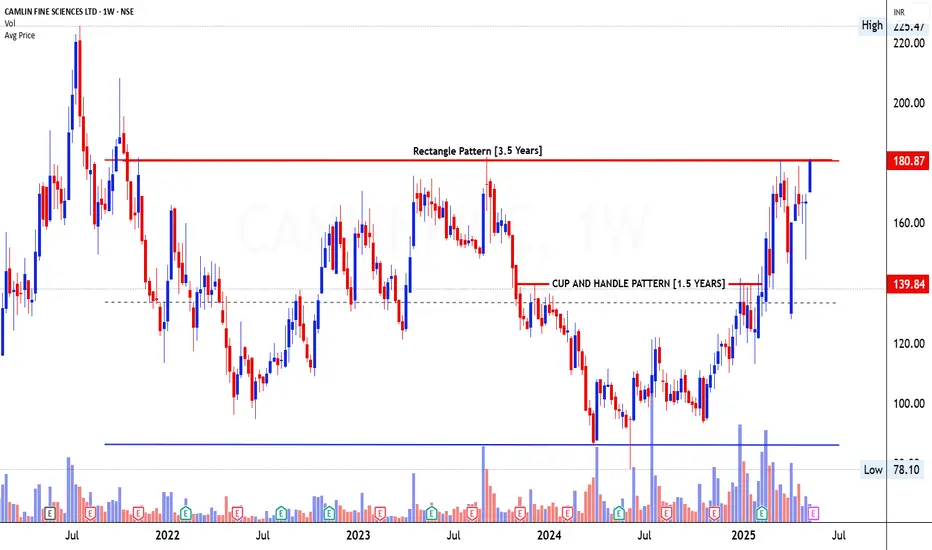
Rectangle Pattern (3.5 Years) on Weekly Chart
The stock of Camlin Fine Sciences Ltd has been coiling inside a broad Rectangle Pattern for over 3.5 years, bounded by a solid support near ₹78 and resistance near ₹181. This long consolidation phase indicates prolonged accumulation, marked by multiple failed attempts to cross the ₹180 zone, creating a horizontal ceiling.
Price behavior has been extremely constructive:
* Compression near the resistance zone signals absorption of supply
* The stock is now testing the upper resistance of ₹180.87 with strength
② Volume Formation (During Pattern, Breakout, and Retest)
* Volume dried up during the handle phase, confirming lack of aggressive selling
* Breakout rally saw multiple weekly spikes in volume, particularly near ₹140 and again as price approached ₹180
* Volume this week stands at 2.91M, above the 20-week average (approx. 2M), indicating accumulation by smart money
* Volume clusters on rallies and fades on corrections = institutional footprint
③ Breakout Candlestick, Follow-Through & Trap Behavior
* The breakout candle is a strong full-bodied bullish bar, closing near high of week, with no upper wick — a sign of conviction
* Previous week was an inside bar showing hesitation, but no breakdown, which has now been invalidated
* No visible trap or shakeout on breakout — the trap happened earlier in the handle dip around ₹130-140, where weak hands were shaken out
* Clean follow-through over past 3 weeks with higher closes
④ Trade Explanation (Entry, Target, Stop-loss, Risk\:Reward)
* Entry Zone: ₹180–183 (Breakout zone)
* Stop-loss: ₹139 (Base of handle and prior breakout resistance)
* Target Zone: ₹250–265 (Measured move from rectangle height: ₹180–₹78 = ₹102. Add ₹102 to breakout = ₹282 max potential. Conservatively ₹250–265)
* Risk\:Reward: Approx 1:2.5+
→ Risk: ₹40, Reward: ₹70–85
The breakout from a multi-year range, backed by strong volume and constructive price action, gives high conviction. Ideal for positional swing traders.
📌 Price: ₹179.00 📊 Volume: 2.91M 📅 Date: 13-05-2025
① Pattern Name, Timeframe, Structure & Explanation
Rectangle Pattern (3.5 Years) on Weekly Chart
The stock of Camlin Fine Sciences Ltd has been coiling inside a broad Rectangle Pattern for over 3.5 years, bounded by a solid support near ₹78 and resistance near ₹181. This long consolidation phase indicates prolonged accumulation, marked by multiple failed attempts to cross the ₹180 zone, creating a horizontal ceiling.
Price behavior has been extremely constructive:
* Compression near the resistance zone signals absorption of supply
* The stock is now testing the upper resistance of ₹180.87 with strength
② Volume Formation (During Pattern, Breakout, and Retest)
* Volume dried up during the handle phase, confirming lack of aggressive selling
* Breakout rally saw multiple weekly spikes in volume, particularly near ₹140 and again as price approached ₹180
* Volume this week stands at 2.91M, above the 20-week average (approx. 2M), indicating accumulation by smart money
* Volume clusters on rallies and fades on corrections = institutional footprint
③ Breakout Candlestick, Follow-Through & Trap Behavior
* The breakout candle is a strong full-bodied bullish bar, closing near high of week, with no upper wick — a sign of conviction
* Previous week was an inside bar showing hesitation, but no breakdown, which has now been invalidated
* No visible trap or shakeout on breakout — the trap happened earlier in the handle dip around ₹130-140, where weak hands were shaken out
* Clean follow-through over past 3 weeks with higher closes
④ Trade Explanation (Entry, Target, Stop-loss, Risk\:Reward)
* Entry Zone: ₹180–183 (Breakout zone)
* Stop-loss: ₹139 (Base of handle and prior breakout resistance)
* Target Zone: ₹250–265 (Measured move from rectangle height: ₹180–₹78 = ₹102. Add ₹102 to breakout = ₹282 max potential. Conservatively ₹250–265)
* Risk\:Reward: Approx 1:2.5+
→ Risk: ₹40, Reward: ₹70–85
The breakout from a multi-year range, backed by strong volume and constructive price action, gives high conviction. Ideal for positional swing traders.
Learn Today for Better Tomorrow
إخلاء المسؤولية
لا يُقصد بالمعلومات والمنشورات أن تكون، أو تشكل، أي نصيحة مالية أو استثمارية أو تجارية أو أنواع أخرى من النصائح أو التوصيات المقدمة أو المعتمدة من TradingView. اقرأ المزيد في شروط الاستخدام.
Learn Today for Better Tomorrow
إخلاء المسؤولية
لا يُقصد بالمعلومات والمنشورات أن تكون، أو تشكل، أي نصيحة مالية أو استثمارية أو تجارية أو أنواع أخرى من النصائح أو التوصيات المقدمة أو المعتمدة من TradingView. اقرأ المزيد في شروط الاستخدام.