CHOLAFIN- Cup & Handle Breakout with Strong Fundamentals
CHOLAFIN – Cup & Handle Breakout with Strong Fundamentals ☕📈
📅 Published on: April 17, 2025
📊 Technical Analysis:
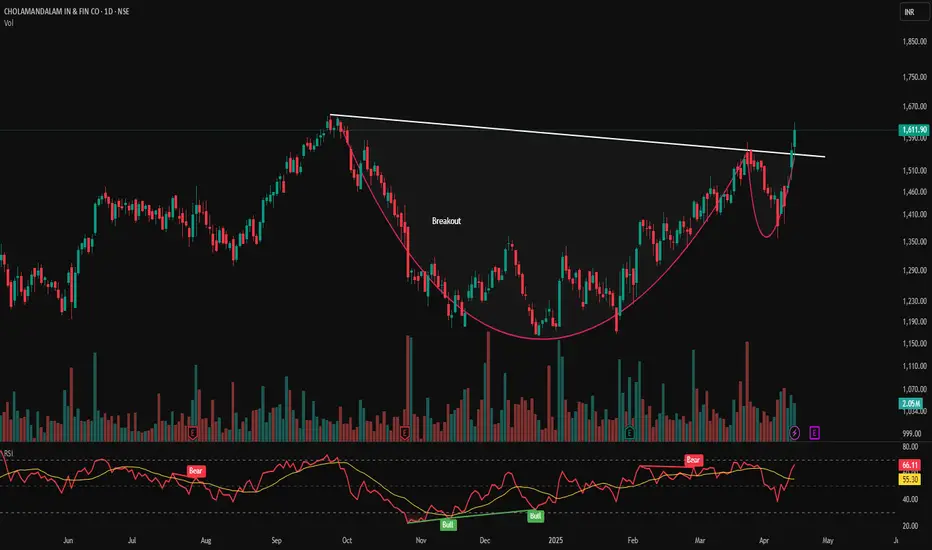
CHOLAFIN has formed a classic Cup & Handle pattern on the daily chart, indicating a potential bullish continuation. The breakout above the neckline is accompanied by increased volume, suggesting strong buying interest.
Pattern: Cup & Handle
Neckline Breakout Level: ₹1,570
Current Price: ₹1,611.90 (+3.31%)
Volume: 2.05M—significant increase confirming breakout
Support & Resistance Levels:
Immediate Support: ₹1,570
Next Support: ₹1,500
Resistance Levels:
Indicators:
RSI: 66.11—approaching overbought territory, indicating strong momentum
MACD: Bullish crossover observed, supporting upward movement
🏢 Fundamental Analysis:
Cholamandalam Investment and Finance Company Ltd. is a leading NBFC in India, operating in vehicle finance, home loans, and corporate finance sectors.
Key Financial Metrics:
Recent Performance:
Net Profit Margin: 18.16%
Return on Assets: 2.18%
Asset Turnover Ratio: 0.14
The company has demonstrated consistent profit growth over the past five years, with a CAGR of 23.4%.
📌 Trade Strategy (For Educational Purposes):
Entry Point: ₹1,570–₹1,600 (on retest)
Stop Loss: ₹1,500
Target Levels:
📍 Visual Elements:
🔔 Disclaimer: This analysis is for educational purposes only. Please conduct your own research or consult a financial advisor before making investment decisions.
📅 Published on: April 17, 2025
📊 Technical Analysis:
CHOLAFIN has formed a classic Cup & Handle pattern on the daily chart, indicating a potential bullish continuation. The breakout above the neckline is accompanied by increased volume, suggesting strong buying interest.
Pattern: Cup & Handle
Neckline Breakout Level: ₹1,570
Current Price: ₹1,611.90 (+3.31%)
Volume: 2.05M—significant increase confirming breakout
Support & Resistance Levels:
Immediate Support: ₹1,570
Next Support: ₹1,500
Resistance Levels:
- ₹1,635
- ₹1,680
- ₹1,750
Indicators:
RSI: 66.11—approaching overbought territory, indicating strong momentum
MACD: Bullish crossover observed, supporting upward movement
🏢 Fundamental Analysis:
Cholamandalam Investment and Finance Company Ltd. is a leading NBFC in India, operating in vehicle finance, home loans, and corporate finance sectors.
Key Financial Metrics:
- Market Cap: ₹1,20,302 Cr
- PE Ratio: 29.60
- PB Ratio: 5.62
- ROE: 17.41%
- ROCE: 11.23%
- Dividend Yield: 0.14%
Recent Performance:
Net Profit Margin: 18.16%
Return on Assets: 2.18%
Asset Turnover Ratio: 0.14
The company has demonstrated consistent profit growth over the past five years, with a CAGR of 23.4%.
📌 Trade Strategy (For Educational Purposes):
Entry Point: ₹1,570–₹1,600 (on retest)
Stop Loss: ₹1,500
Target Levels:
- ₹1,635
- ₹1,680
- ₹1,750
📍 Visual Elements:
- Cup & Handle pattern highlighted
- Breakout point marked
- Support and resistance levels indicated
- Volume bars showing increased activity
- RSI and MACD indicators displayed
🔔 Disclaimer: This analysis is for educational purposes only. Please conduct your own research or consult a financial advisor before making investment decisions.
أغلقت الصفقة: تم الوصول للهدف
The first resistance level has been touched. If the trend is to continue, it's important to follow a trailing stop-loss strategy and patiently wait for the price to approach the second resistance level.إخلاء المسؤولية
لا يُقصد بالمعلومات والمنشورات أن تكون، أو تشكل، أي نصيحة مالية أو استثمارية أو تجارية أو أنواع أخرى من النصائح أو التوصيات المقدمة أو المعتمدة من TradingView. اقرأ المزيد في شروط الاستخدام.
إخلاء المسؤولية
لا يُقصد بالمعلومات والمنشورات أن تكون، أو تشكل، أي نصيحة مالية أو استثمارية أو تجارية أو أنواع أخرى من النصائح أو التوصيات المقدمة أو المعتمدة من TradingView. اقرأ المزيد في شروط الاستخدام.