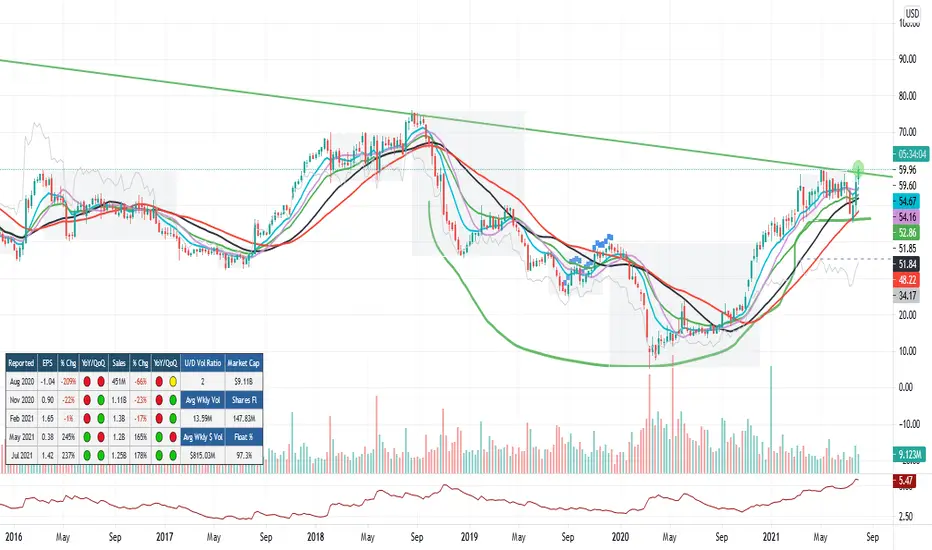
Wow,  CPRI looks to be breaking out of a long term down trend. This is a weekly chart. The longer term down trend line was drawn from a monthly chart. This looks like it's breaking out of a Cup with Handle formation on the weekly and the monthly long term down trend. I have this on my watch list to see how it acts next week. Take a look at the last 2 earnings beat on the chart ( Earnings Indicator courtesy of @JohnMuchow on TradingView ). Ideas, not investing / trading advice.
Ideas I publish are my own. They are not meant to be investment / trading advice. You are encouraged to do your own due diligence.
I am under no obligation to post any action or update to any idea.
Follow me on "X" where I post more content.
I am under no obligation to post any action or update to any idea.
Follow me on "X" where I post more content.
إخلاء المسؤولية
The information and publications are not meant to be, and do not constitute, financial, investment, trading, or other types of advice or recommendations supplied or endorsed by TradingView. Read more in the Terms of Use.