Cycle lines are one of my favourite things. Not only can you get an indication of potential price, but there is also possibly the more critical factor of getting your timing right. This is a chart that I had done long ago and I found it while trawling through an old watchlist. As such, the lines on here are for a arithmetic chart, not a log chart as shown. I work off an iPad normally so you’ll be lucky to get another chart out of me. However, in order to get the cycle lines to match up sacrifices had to be made.
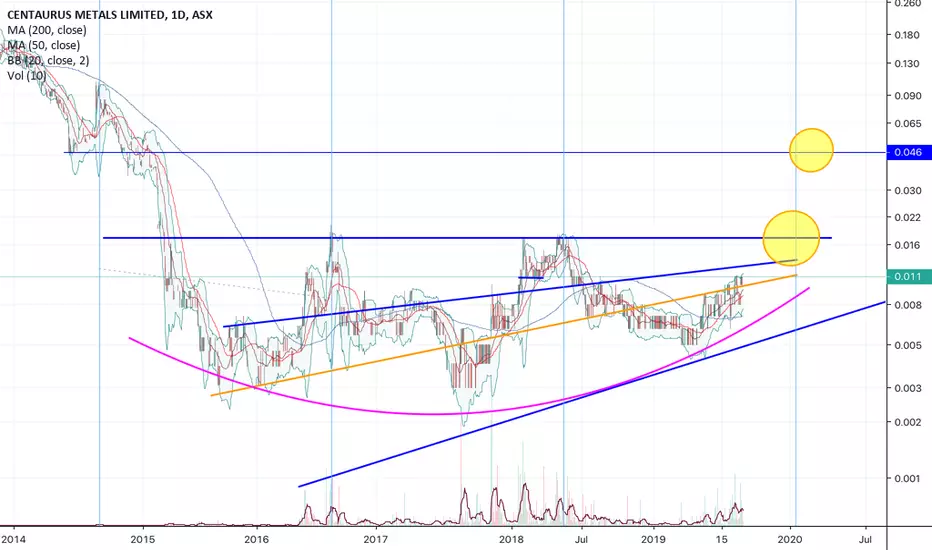
As you can see, since mid 2014 there has been a repeating cycle of roughly 1 and a half years duration. It appears that at the time that it has reached the bottom of this cycle that it is gearing up for another run. However, we appear to be blessed, as the coincides with a rounding bottom drawn in with pink. If the cycle continues, a primary target of 0.017 can be set. However if a breakout occurs at that point a secondary target is available to 0.046, based on a previous level of resistance.
As you can see, since mid 2014 there has been a repeating cycle of roughly 1 and a half years duration. It appears that at the time that it has reached the bottom of this cycle that it is gearing up for another run. However, we appear to be blessed, as the coincides with a rounding bottom drawn in with pink. If the cycle continues, a primary target of 0.017 can be set. However if a breakout occurs at that point a secondary target is available to 0.046, based on a previous level of resistance.
ملاحظة
A pop to day on the back of a funding announcement. Price hit 0.14. Also noticed a very tight correlation between CTM and nickel at a time where the nickel price is beginning to move. Hold tight.ملاحظة
Looks like the pattern is holding so far. If you look back on the three cycle lines you'll see that before the big push there is a minor peak and then the price receeds for a little bit. Each time this happens we get a text book double top that takes us back down the the lower trendlines. In this case if the double top happens it will be a break of the rounding bottom and potentially a failure of this whole set up. At the moment for this pull back I'm keeping my eyes set on the 0.011 level and dare I say it, it may be my stop loss line. If this holds we have a strong pennant which is a continuation pattern which could bring a break of the 0.017 mark. I would say that we should see the second peak in early November.
ملاحظة
It has been bought to my attention that a heap of nickel supply is coming offline at the moment, at the same time when world nickel stocks are very low. Fundamentals lining up with technicals makes for a crazy comboملاحظة
Looks like we just had our first little lick of 0.017. If anything this is running ahead of schedule so looks like the market is getting itchy. Stop moved up to 0.015.ملاحظة
Nope. What a shame. I don't think this trade is done yet, but I think we're going to have to wait a bit longer before we see anything else.إخلاء المسؤولية
لا يُقصد بالمعلومات والمنشورات أن تكون، أو تشكل، أي نصيحة مالية أو استثمارية أو تجارية أو أنواع أخرى من النصائح أو التوصيات المقدمة أو المعتمدة من TradingView. اقرأ المزيد في شروط الاستخدام.
إخلاء المسؤولية
لا يُقصد بالمعلومات والمنشورات أن تكون، أو تشكل، أي نصيحة مالية أو استثمارية أو تجارية أو أنواع أخرى من النصائح أو التوصيات المقدمة أو المعتمدة من TradingView. اقرأ المزيد في شروط الاستخدام.