1. Pattern Analysis
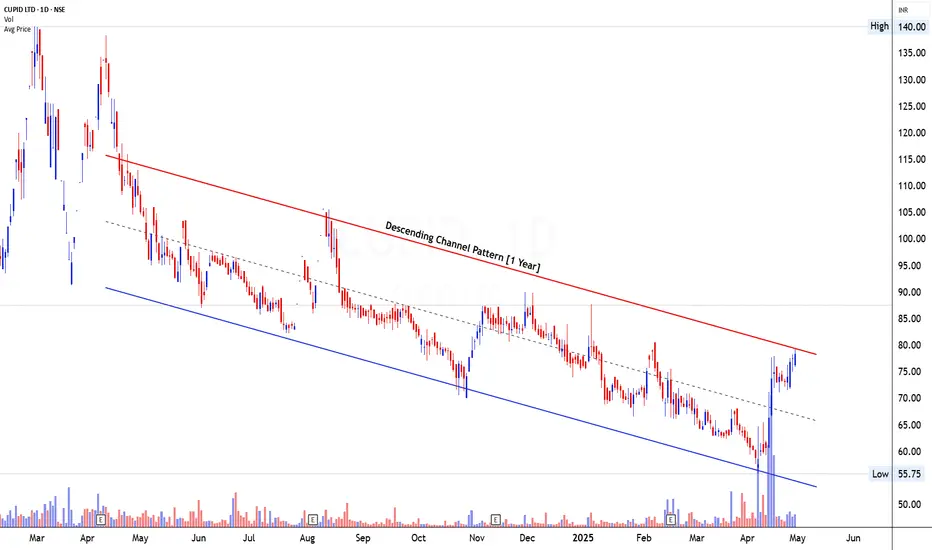
CUPID Ltd has been trading within a well-defined Descending Channel Pattern for the past 1 year, marked by a consistent sequence of lower highs and lower lows. The pattern is bounded by a red resistance line at the top and a blue support line at the bottom, reflecting a controlled downtrend. This descending channel reflects a classic corrective phase after a prior sharp fall, allowing the stock to gradually stabilize its structure. As of the latest price action, CUPID is testing the upper boundary of this descending channel, suggesting a potential breakout attempt. While a clean breakout hasn’t yet been confirmed, the approach toward this resistance zone after a strong move from the lower boundary increases the probability of bullish continuation. The channel structure remains valid and offers a clear risk-to-reward framework for traders anticipating a breakout.
2. Volume Analysis
Volume behavior in CUPID has undergone a significant shift in recent sessions. During the earlier phases of the downtrend, volume remained muted and largely unconvincing on both up and down days, confirming the overall weakness. However, in the most recent up move, particularly the rally from ₹56 to ₹78, there has been a noticeable surge in volume, pointing toward renewed buying interest. Notably, the bars representing this advance have coincided with volume expansion, which is often an early indicator of accumulation. This surge hints at the presence of institutional or smart money entering the counter at lower levels. Additionally, the volume spike near the lower blue channel support suggests buyers stepping in strongly at value zones, further lending strength to the ongoing bullish momentum.
3. Candlestick Analysis / Price Analysis
The price action in CUPID has shifted to a bullish tone, especially since bouncing off the lower boundary of the channel. Over the past few weeks, the stock has formed a series of higher lows, and the recent candles are characterized by strong bodies with minimal upper wicks—indicative of decisive bullish control. The move from the ₹56–₹58 zone to ₹78 has been quick and with conviction. These price formations near the channel resistance convey an intent to break out rather than reject the level, which makes the ongoing structure even more interesting. The absence of strong bearish reversal candles and the steady upward grind suggest that sellers are gradually losing control. Additionally, the recent price bars have consistently closed near their intraday highs, signaling aggressive buying during market sessions.
4. Validation of Signal
Although the price has not yet cleanly broken out of the descending channel, the convergence of volume, price behavior, and structure validates a bullish setup in progress. The current structure hints that CUPID is building strength for a breakout. The key validation will occur once the price closes above ₹80–₹82 with strong volume, confirming that supply has been absorbed. Until then, the setup can be considered a pre-breakout accumulation stage with bullish bias. The stock has not shown signs of exhaustion or long-wick candles that would indicate rejection, reinforcing the expectation of further upside. A breakout from such a long-standing descending channel would signal a major reversal, potentially changing the trend from bearish to bullish for the medium term.
5. Tradable Points Determination
Entry Point Determination
An ideal entry can be considered near the current levels around ₹76–₹78, with confirmation to add aggressively above ₹82 once a breakout candle closes strongly. Traders willing to anticipate the breakout may initiate positions with tighter risk management.
Target Point Determination
The height of the descending channel is approximately ₹35–₹40, ranging from the lower boundary (₹55) to the upper resistance (₹90). On a successful breakout above ₹82, we can expect the following targets:
Target 1: ₹95 (near-term resistance)
Target 2: ₹105–₹110 (measured move projection)
Target 3: ₹120+ (extended rally potential)
Stop Loss Placement and Trailing SL Follow-Up
A logical stop loss should be placed just below the recent swing low at ₹70 to protect against failed breakout attempts.
For trailing:
Move SL to ₹75 once price crosses ₹90
Move SL to ₹85 once price crosses ₹100
Lock profits at ₹95+ and trail for ₹110 or beyond
This trailing approach ensures protection of profits while participating in potential long-term reversal.
Learn Today for Better Tomorrow
إخلاء المسؤولية
لا يُقصد بالمعلومات والمنشورات أن تكون، أو تشكل، أي نصيحة مالية أو استثمارية أو تجارية أو أنواع أخرى من النصائح أو التوصيات المقدمة أو المعتمدة من TradingView. اقرأ المزيد في شروط الاستخدام.
Learn Today for Better Tomorrow
إخلاء المسؤولية
لا يُقصد بالمعلومات والمنشورات أن تكون، أو تشكل، أي نصيحة مالية أو استثمارية أو تجارية أو أنواع أخرى من النصائح أو التوصيات المقدمة أو المعتمدة من TradingView. اقرأ المزيد في شروط الاستخدام.