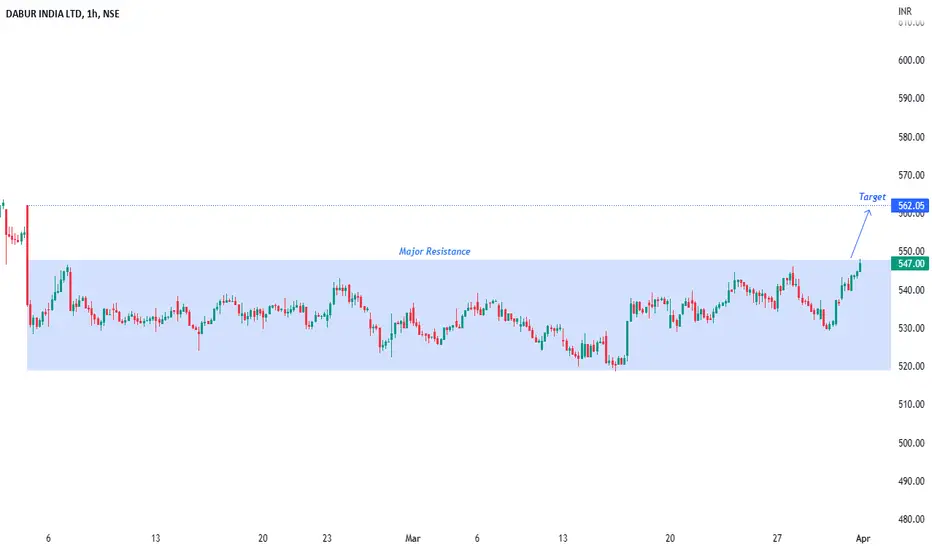
Hourly chart of Dabur India is indicating that it is trading in a parallel channel daily chart is also good and gives a highest closing after 3rd February 2023 so if it will break the resistance of that channel on hourly candle basis we can go long for the target of 562 in it with the stop loss of a candle close below the resistance of channel.
𝑵𝑶𝑻𝑬- 𝑶𝑵𝑳𝒀 𝑭𝑶𝑹 𝑬𝑫𝑼𝑪𝑨𝑻𝑰𝑶𝑵 𝑷𝑼𝑹𝑷𝑶𝑺𝑬
𝑵𝑶𝑻𝑬- 𝑶𝑵𝑳𝒀 𝑭𝑶𝑹 𝑬𝑫𝑼𝑪𝑨𝑻𝑰𝑶𝑵 𝑷𝑼𝑹𝑷𝑶𝑺𝑬
ملاحظة
KEEP ON RADARأغلقت الصفقة: تم الوصول للهدف
إخلاء المسؤولية
The information and publications are not meant to be, and do not constitute, financial, investment, trading, or other types of advice or recommendations supplied or endorsed by TradingView. Read more in the Terms of Use.
إخلاء المسؤولية
The information and publications are not meant to be, and do not constitute, financial, investment, trading, or other types of advice or recommendations supplied or endorsed by TradingView. Read more in the Terms of Use.