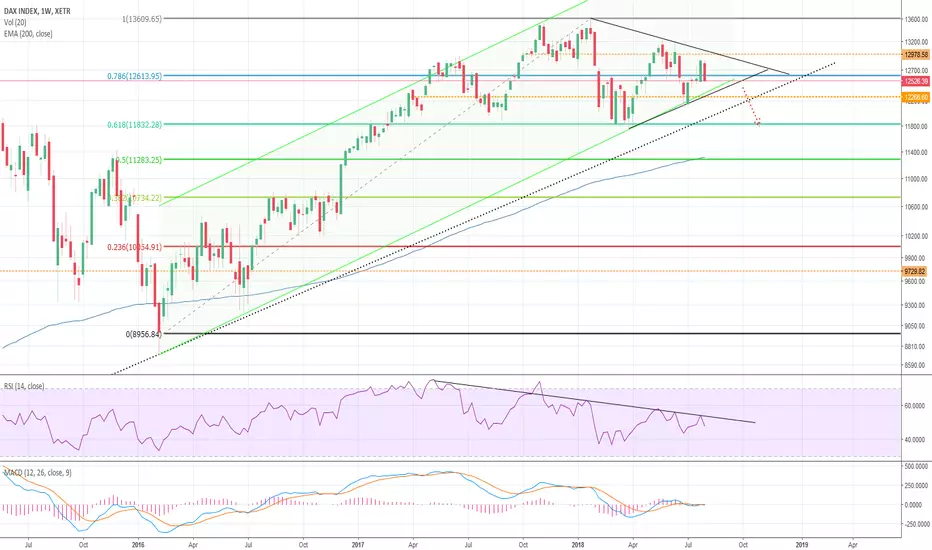
The german index has left some of its strength in the past days. The recover from 11800 has not led to higher prices.
The index is actually within a bearish symmetrical triangle. It´s bearish because the last high was lower than the high before - and so on.
Meanwhile the Relative Strength Indicator (RSI) has had a negative trend since may 2017! - with one interruption in octobre 2017.
But the index had its highest price on january 2018 - so we´ve got a long negative divergence between the price and the indicator.
Outlook:
The DAX is heading to the lower limit of the triangle.
With RSI getting lower and MACD not giving any support it is to be expected that the index stays weak and / or getting even weaker in the next time.
We´ve got some support-levels :
a) ~ 12260 (swing trend line (orange dotted))
b) ascending trend line (black dotted); actually at 11.900 - coming up to 12600
c) 11830 (fib retracement 61.8%), which should be a stronger support
The EMA 200 is actually at 11330
On the upside (not very probable):
a) 12600 (fib retracement 78.6% and a swing trend line) - actually the next resistance
b) 13000 (swing trend line)
c) 13609 (the last ATH)
إخلاء المسؤولية
لا يُقصد بالمعلومات والمنشورات أن تكون، أو تشكل، أي نصيحة مالية أو استثمارية أو تجارية أو أنواع أخرى من النصائح أو التوصيات المقدمة أو المعتمدة من TradingView. اقرأ المزيد في شروط الاستخدام.
إخلاء المسؤولية
لا يُقصد بالمعلومات والمنشورات أن تكون، أو تشكل، أي نصيحة مالية أو استثمارية أو تجارية أو أنواع أخرى من النصائح أو التوصيات المقدمة أو المعتمدة من TradingView. اقرأ المزيد في شروط الاستخدام.