Hit like & follow guys ;)
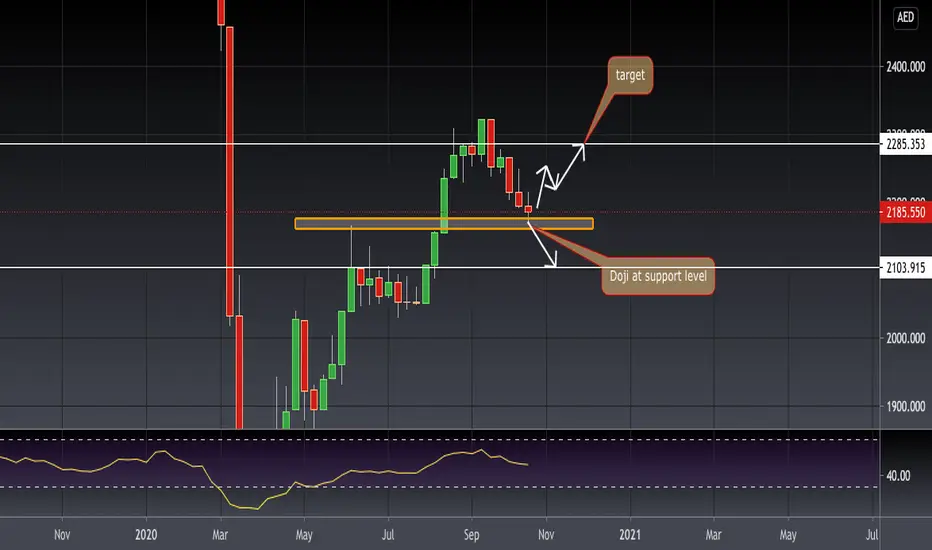
If we analyse weekly chart the uptrend is still intact and we are seeing a perfect doji candle at the support level. Good chances of market continuing its uptrend from this level. If 2185 holds up and if we can see a weekly candle close above 2220 it will be a good sign that market want to go higher. But at the same time if this level does not hold market can quickly slip to 2100 levels. Over all on a bigger time frame it looks bullish.
If we analyse weekly chart the uptrend is still intact and we are seeing a perfect doji candle at the support level. Good chances of market continuing its uptrend from this level. If 2185 holds up and if we can see a weekly candle close above 2220 it will be a good sign that market want to go higher. But at the same time if this level does not hold market can quickly slip to 2100 levels. Over all on a bigger time frame it looks bullish.
إخلاء المسؤولية
لا يُقصد بالمعلومات والمنشورات أن تكون، أو تشكل، أي نصيحة مالية أو استثمارية أو تجارية أو أنواع أخرى من النصائح أو التوصيات المقدمة أو المعتمدة من TradingView. اقرأ المزيد في شروط الاستخدام.
إخلاء المسؤولية
لا يُقصد بالمعلومات والمنشورات أن تكون، أو تشكل، أي نصيحة مالية أو استثمارية أو تجارية أو أنواع أخرى من النصائح أو التوصيات المقدمة أو المعتمدة من TradingView. اقرأ المزيد في شروط الاستخدام.