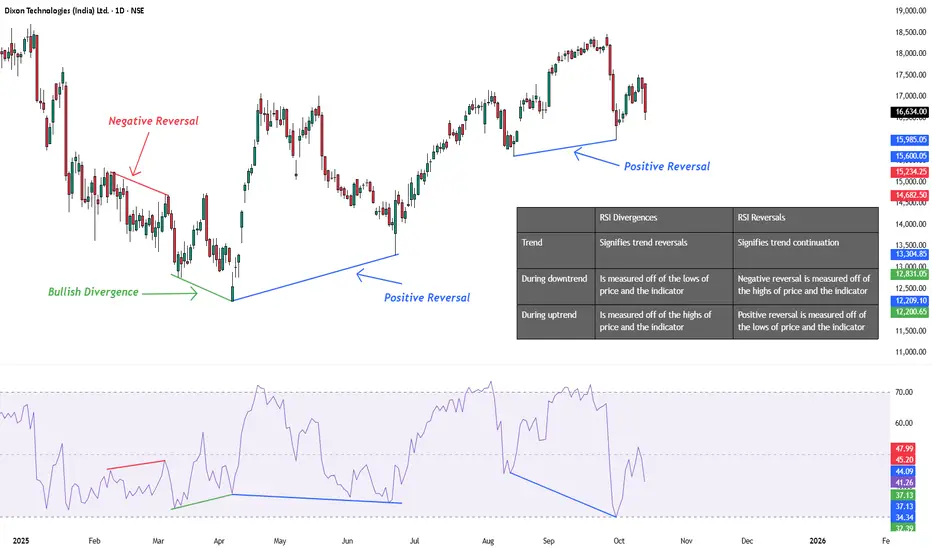
While most traders look for RSI divergences to catch tops and bottoms, RSI reversals often go unnoticed — yet they mark trend continuation points with precision.
In Dixon’s case, positive RSI reversals have repeatedly emerged at higher lows — each time leading to a renewed rally. The indicator is quietly hinting that the broader uptrend remains intact unless these structural lows break.
RSI Note:
Positive reversals = trend continuation.
Divergences = trend reversal signals.
Strategy:
Bias stays bullish as long as the recent higher-low structure holds.
Disclaimer:
This analysis is for educational purposes only and does not constitute investment advice. Please do your own research (DYOR) before making any trading decisions.
WaveXplorer | Elliott Wave insights
📊 X profile: @veerappa89
📊 X profile: @veerappa89
منشورات ذات صلة
إخلاء المسؤولية
لا يُقصد بالمعلومات والمنشورات أن تكون، أو تشكل، أي نصيحة مالية أو استثمارية أو تجارية أو أنواع أخرى من النصائح أو التوصيات المقدمة أو المعتمدة من TradingView. اقرأ المزيد في شروط الاستخدام.