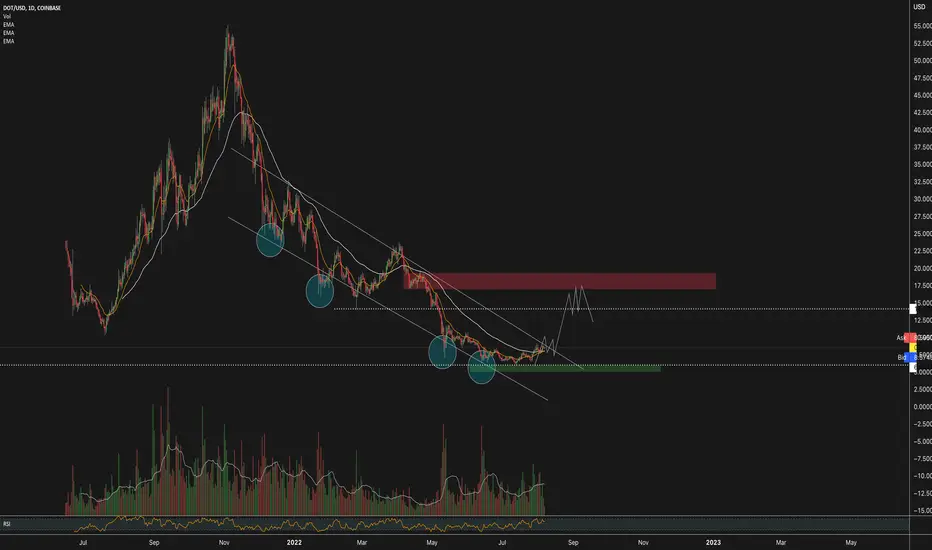
Looks like hit hit a lot of stopping volume. In VSA you could say that t was accumulating off of the "demand line" (circled). On the lower time frames you will be able to make out the uptrend with a bit more detail. Probably too high to long from here. Could use a bit of a pull back before looking for a re-accumulation pattern since it is intersecting with the "supply line". But what does the volume indicate at the supply line? Is the pressure high or will it be able to break through?
إخلاء المسؤولية
لا يُقصد بالمعلومات والمنشورات أن تكون، أو تشكل، أي نصيحة مالية أو استثمارية أو تجارية أو أنواع أخرى من النصائح أو التوصيات المقدمة أو المعتمدة من TradingView. اقرأ المزيد في شروط الاستخدام.
إخلاء المسؤولية
لا يُقصد بالمعلومات والمنشورات أن تكون، أو تشكل، أي نصيحة مالية أو استثمارية أو تجارية أو أنواع أخرى من النصائح أو التوصيات المقدمة أو المعتمدة من TradingView. اقرأ المزيد في شروط الاستخدام.