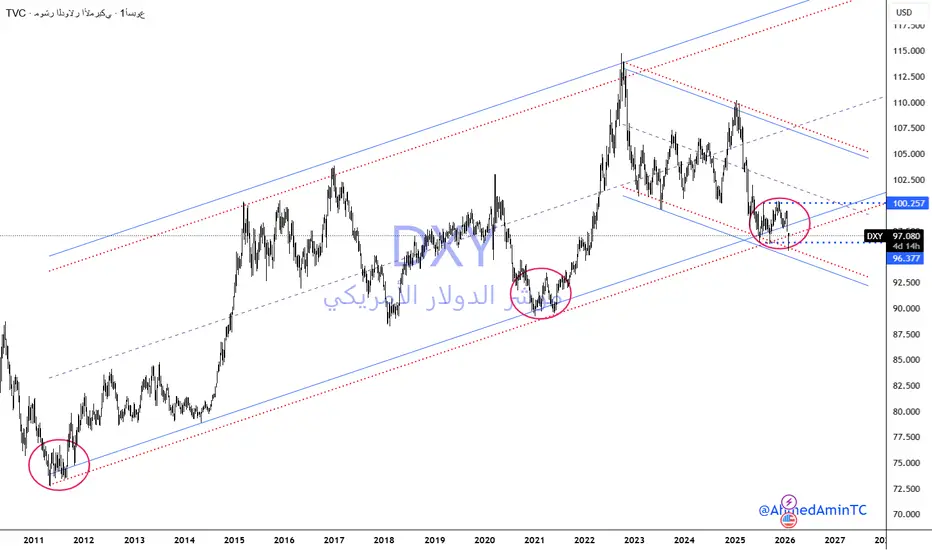
يختبر مؤشر الدولار دعوماً تاريخية هامة مع توقعات بالاستقرار فوق 96 نقطة، واختراق مستوي 100.25 سيؤكد العودة للمسار الصاعد نحو 106. بالمقابل، فإن كسر مستوى 96 نقطة سيلغي التوقعات الإيجابية ويدفع المؤشر للهبوط نحو مستويات 89 نقطة
-----------
ظهر مؤشر الدولار الأمريكي تبايناً في الأداء عبر الأطر الزمنية المختلفة؛ حيث لا يزال يحافظ على اتجاذه الصاعد (Bullish Trend) على المدى طويل الأجل، بينما يسلك مساراً هابطاً (Bearish) على المدى المتوسط، ودخل مؤخراً في مرحلة تداول عرضي (Sideways/Consolidation) على المدى القصير.
النقاط الفنية :
الدعم : يتداول المؤشر حالياً فوق خط الاتجاه الصاعد والقناة السعرية الصاعدة طويلة الأجل، مختبراً الحد السفلي لها حول 94.00 نقطة .
تلاقي الدعوم: يختبر السعر حالياً مستويات دعم حرجة تمثل الحد السفلي للقناة الهابطة المتكونة منذ أكتوبر 2022، بالتزامن مع مستويات دعم المدى القصير حول 94.00 نقطة بجانب اختبار خط الاتجاه الصلعد والحد السفلى للقناة السعرية الصاعدة منذ عام 2011 .
السيناريو المتوقع (الربع الأول 2026): يُتوقع استقرار المؤشر أعلى منطقة الدعم الرئيسية حول 96 نقطة. وفي حال نجاحه في إعادة اختبار مستوى 100.25 نقطة والاغلاق أعلاها بنهاية الربع الأول، سيفتح ذلك الباب لاستعادة الزخم الصاعد نحو مستويات 104 - 106 نقطة خلال ما تبقى من عام 2026.
إدارة المخاطر (إلغاء السيناريو): يظل السيناريو الصاعد قائماً ما لم يتم الإغلاق دون مستويات 96 نقطة. كسر هذا الدعم يعتبر إشارة سلبية قوية تلغي النظرة التفاؤلية وتدفع المؤشر نحو مستويات عام 2020 بالقرب من 89 نقطة.
---------------------------------------
DXY is testing critical historical supports; a stable hold above 96.00 and a breakout over 100.25 would signal a bullish rally toward 106.00. Conversely, a decisive close below 96.00 invalidates the recovery thesis, shifting the bearish target toward the 89.00 level
------------------------------------
Market Sentiment & Trend Overview: The U.S. Dollar Index (DXY) is exhibiting divergent performance across various timeframes. While it maintains its long-term bullish trend, the index is currently following a medium-term bearish trajectory and has recently entered a short-term sideways consolidation phase.
Technical Points:
Support Levels: The index is currently trading above the long-term ascending trendline and the major bullish channel, testing their lower boundary near the 94.00 mark.
Confluence of Support: Price action is currently testing critical support levels represented by the lower rail of the descending channel (formed since October 2022). This coincides with short-term support levels around 94.00, alongside a significant test of the ascending trendline and the lower boundary of the bullish channel that has been in place since 2011.
Projected Scenario (Q1 2026): The index is expected to stabilize above the primary support zone near 96.00. A successful retest and a decisive close above the 100.25 pivot level by the end of Q1 would pave the way for a resurgence in bullish momentum, targeting the 104.00 – 106.00 range throughout the remainder of 2026.
Risk Management (Invalidation Thesis): The bullish outlook remains valid as long as the index maintains its position above the 96.00 support level. A sustained close below this threshold would serve as a major bearish signal, invalidating the current recovery thesis and shifting the downside target toward the 2020 lows near the 89.00 level.
Ahmed Amin
00201227212691
twitter.com/AhmedAminTC
snapchat.com/add/ahmedamintc?share_id=SQYebO-s9zs&locale=en-EG
00201227212691
twitter.com/AhmedAminTC
snapchat.com/add/ahmedamintc?share_id=SQYebO-s9zs&locale=en-EG
إخلاء المسؤولية
لا يُقصد بالمعلومات والمنشورات أن تكون، أو تشكل، أي نصيحة مالية أو استثمارية أو تجارية أو أنواع أخرى من النصائح أو التوصيات المقدمة أو المعتمدة من TradingView. اقرأ المزيد في شروط الاستخدام.