US Dollar Index (DXY) Reaches One-Month High
The US Dollar Index (DXY) has risen to its highest level since early July. According to media reports, the bullish sentiment in the market is driven by the following factors:
→ Optimism around US trade agreements. A new trade deal with the EU — which includes a 15% tariff on European goods — is being perceived by the market as favourable for the United States.
→ Confidence in the resilience of the US economy. Strong Q2 corporate earnings have acted as an additional bullish catalyst. Investors may have started covering short positions against the dollar, viewing concerns over a US slowdown as overstated.
→ Expectations that the Federal Reserve will keep interest rates on hold.
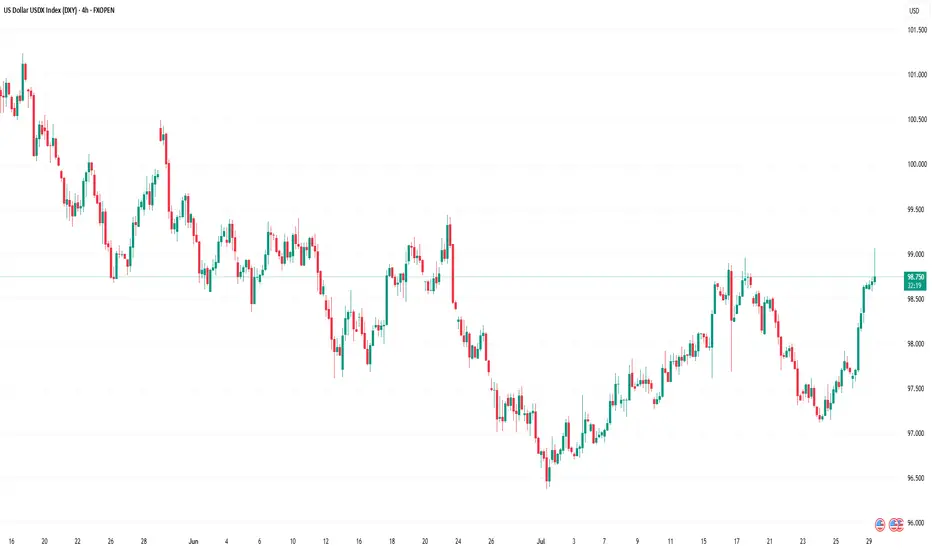
From a technical standpoint, today’s DXY chart reflects strengthening bullish momentum.

Technical Analysis of the DXY Chart
Two U-shaped formations (A and B) that developed over the summer have created a bullish сup and рandle pattern — a formation that suggests waning bearish pressure, as evidenced by the shallower second dip.
This setup points to the potential for a bullish breakout above the trendline (marked in red) that has defined the downward movement in the DXY throughout the first half of 2025.
As previously analysed, there are signs that the dollar index may have found a base following a period of decline. This could indicate a shift in market sentiment and the possible end of the recent bearish phase.
This article represents the opinion of the Companies operating under the FXOpen brand only. It is not to be construed as an offer, solicitation, or recommendation with respect to products and services provided by the Companies operating under the FXOpen brand, nor is it to be considered financial advice.
The US Dollar Index (DXY) has risen to its highest level since early July. According to media reports, the bullish sentiment in the market is driven by the following factors:
→ Optimism around US trade agreements. A new trade deal with the EU — which includes a 15% tariff on European goods — is being perceived by the market as favourable for the United States.
→ Confidence in the resilience of the US economy. Strong Q2 corporate earnings have acted as an additional bullish catalyst. Investors may have started covering short positions against the dollar, viewing concerns over a US slowdown as overstated.
→ Expectations that the Federal Reserve will keep interest rates on hold.
From a technical standpoint, today’s DXY chart reflects strengthening bullish momentum.
Technical Analysis of the DXY Chart
Two U-shaped formations (A and B) that developed over the summer have created a bullish сup and рandle pattern — a formation that suggests waning bearish pressure, as evidenced by the shallower second dip.
This setup points to the potential for a bullish breakout above the trendline (marked in red) that has defined the downward movement in the DXY throughout the first half of 2025.
As previously analysed, there are signs that the dollar index may have found a base following a period of decline. This could indicate a shift in market sentiment and the possible end of the recent bearish phase.
This article represents the opinion of the Companies operating under the FXOpen brand only. It is not to be construed as an offer, solicitation, or recommendation with respect to products and services provided by the Companies operating under the FXOpen brand, nor is it to be considered financial advice.
إخلاء المسؤولية
The information and publications are not meant to be, and do not constitute, financial, investment, trading, or other types of advice or recommendations supplied or endorsed by TradingView. Read more in the Terms of Use.
إخلاء المسؤولية
The information and publications are not meant to be, and do not constitute, financial, investment, trading, or other types of advice or recommendations supplied or endorsed by TradingView. Read more in the Terms of Use.