The Dollar Index gapped down last week following the French Elections.
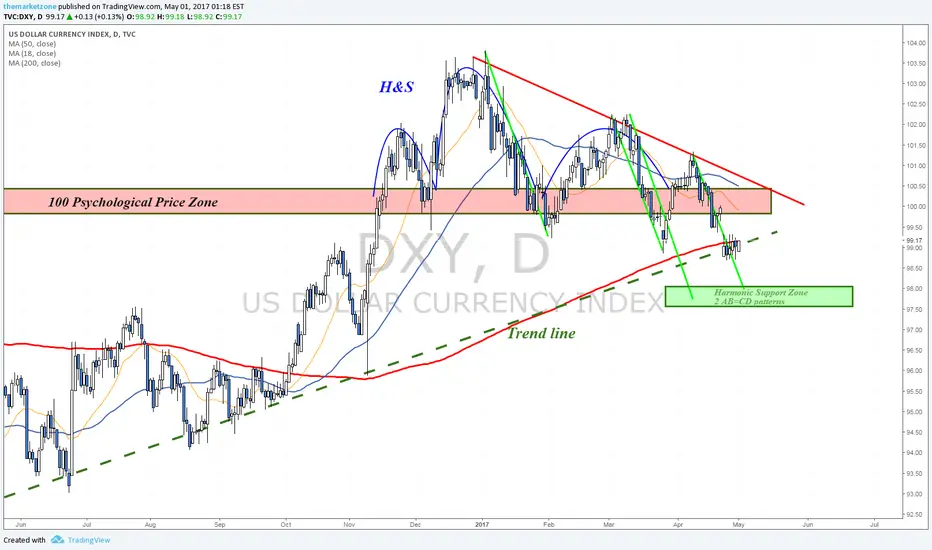
The price couldn't close above its 200 days MA line despite multiple attempts.
What stands between DXY and the next support zone (harmonic support zone shown at the chart) is the uptrend line that still holds as support.
Key Price Zone this week - 99$
A close above the 200 days MA line can send DXY back towards 100$ and the downtrend line.
A close below 99$ can send DXY to test the harmonic support zone (2 AB=CD patterns) near 97.5$
Read more about this analysis and other trading scenarios in my weekly newsletter - #WeeklyMarketsAnalysis on Twitter
منشورات ذات صلة
إخلاء المسؤولية
لا يُقصد بالمعلومات والمنشورات أن تكون، أو تشكل، أي نصيحة مالية أو استثمارية أو تجارية أو أنواع أخرى من النصائح أو التوصيات المقدمة أو المعتمدة من TradingView. اقرأ المزيد في شروط الاستخدام.
إخلاء المسؤولية
لا يُقصد بالمعلومات والمنشورات أن تكون، أو تشكل، أي نصيحة مالية أو استثمارية أو تجارية أو أنواع أخرى من النصائح أو التوصيات المقدمة أو المعتمدة من TradingView. اقرأ المزيد في شروط الاستخدام.