Full Analysis:
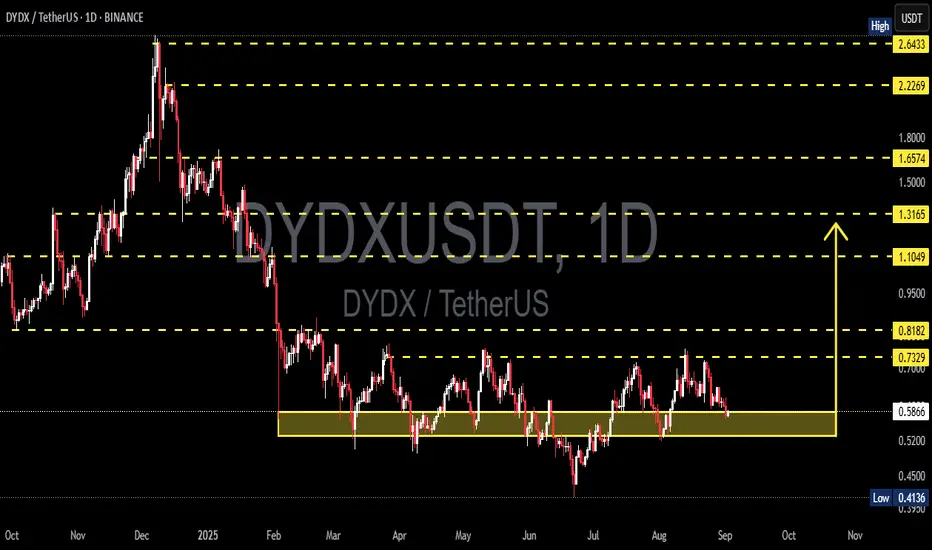
DYDX is currently standing at a critical decision point. The chart shows price retesting the demand zone $0.50–$0.59 (yellow box), which has acted as strong support multiple times since March, June, and August 2025. This zone remains the last stronghold before price revisits the previous low at $0.41.
On the macro view, DYDX is still in a downtrend since the peak at $2.64 (Dec 2024). However, in the mid-term, price is moving sideways inside a broad range of $0.41–$0.82, suggesting accumulation or consolidation before the next major directional move.
---
🔹 Bullish Scenario
If the $0.50–$0.59 zone holds once again, a strong rebound is possible.
Early confirmation: a daily close above $0.64–$0.68, showing buyer rejection at the demand area.
Next resistance targets: $0.73 (range high) → if broken, extension targets are $0.82 → $1.10 → $1.31.
Additional bullish signals: long lower wick candles around support, increasing buy volume, and formation of higher lows.
📈 Swing strategy (bullish): accumulate around $0.52–$0.59, stop-loss below $0.48, profit targets at $0.73–$0.82.
---
🔻 Bearish Scenario
If price fails and closes daily below $0.50, a confirmed breakdown is in play.
Downside targets: $0.41 (previous low), with further bearish continuation possible if that level breaks.
Breakdown of this zone will confirm a continuation of the macro downtrend, likely forming new lower lows.
Additional bearish confirmations: strong daily close below $0.50, heavy sell volume, repeated lower highs pattern.
📉 Swing strategy (bearish): short after breakdown & failed retest of $0.50–$0.52, stop-loss above $0.60, first target $0.41.
---
🔍 Pattern & Market Structure
Range-bound: DYDX has been consolidating within $0.41–$0.82 for months.
Demand Zone in Play: The $0.50–$0.59 zone has been tested three times — each test weakens it, but also increases chances of a strong bounce if buyers step in.
Decision Point: Price action here will decide whether DYDX forms a base for reversal or continues its macro bearish trend.
---
📌 Conclusion
DYDX is testing a critical historical support at $0.50–$0.59. Holding this zone could spark a rebound toward $0.73–$0.82, but a confirmed breakdown below $0.50 would likely extend the bearish trend toward $0.41.
Traders should wait for daily close confirmation before committing, as this area is the true “battle zone” between bulls and bears.
⚠️ Disclaimer: This analysis is not financial advice. Always manage risk and use stop-loss according to your strategy.
#DYDX #DYDXUSDT #Crypto #Altcoins #TechnicalAnalysis #SwingTrading #SupportResistance #PriceAction
✅ Get Free Signals! Join Our Telegram Channel Here: t.me/TheCryptoNuclear
✅ Twitter: twitter.com/crypto_nuclear
✅ Join Bybit : partner.bybit.com/b/nuclearvip
✅ Benefits : Lifetime Trading Fee Discount -50%
✅ Twitter: twitter.com/crypto_nuclear
✅ Join Bybit : partner.bybit.com/b/nuclearvip
✅ Benefits : Lifetime Trading Fee Discount -50%
إخلاء المسؤولية
لا يُقصد بالمعلومات والمنشورات أن تكون، أو تشكل، أي نصيحة مالية أو استثمارية أو تجارية أو أنواع أخرى من النصائح أو التوصيات المقدمة أو المعتمدة من TradingView. اقرأ المزيد في شروط الاستخدام.