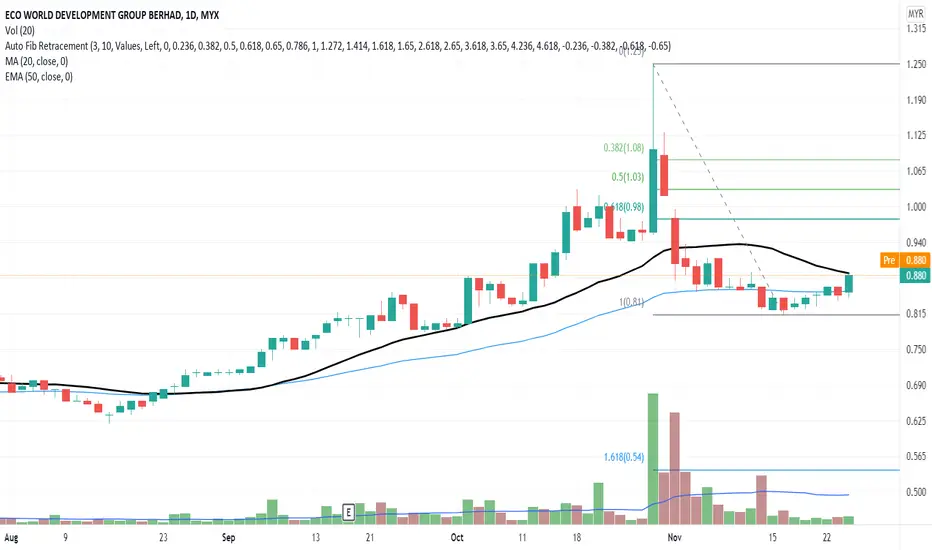
Using Fibonacci Retracement (FIBO) chart, the price indicates a continuous price uptrend momentum from the support line.
MACD and OBV charts indicate an early sign of divergence signal.
Therefore, it is in a good position to buy since it is below-the-market order and waits for the next significant price movement. Hence minimum the exposure risk from buying at peak price.
Put ECOWLD to your WL and watch out for significant price movement with volume or after the candlestick body crosses the MA20 line.
R 0.885
S 0.840
منشورات ذات صلة
إخلاء المسؤولية
لا يُقصد بالمعلومات والمنشورات أن تكون، أو تشكل، أي نصيحة مالية أو استثمارية أو تجارية أو أنواع أخرى من النصائح أو التوصيات المقدمة أو المعتمدة من TradingView. اقرأ المزيد في شروط الاستخدام.
منشورات ذات صلة
إخلاء المسؤولية
لا يُقصد بالمعلومات والمنشورات أن تكون، أو تشكل، أي نصيحة مالية أو استثمارية أو تجارية أو أنواع أخرى من النصائح أو التوصيات المقدمة أو المعتمدة من TradingView. اقرأ المزيد في شروط الاستخدام.