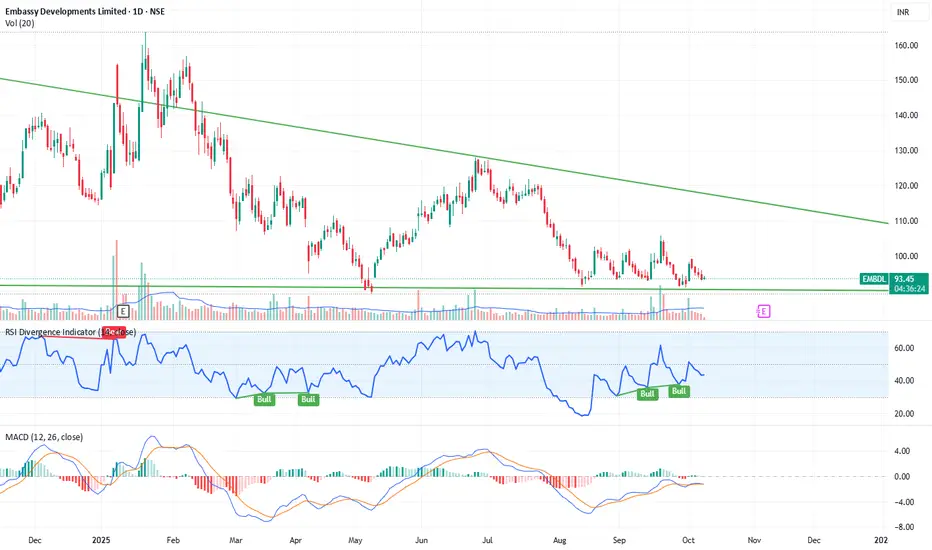
This chart of Embassy Developments Limited (EMBDL) showcases a potential shift in momentum, signaling a bullish reversal from its recent downtrend. Here's a closer look at the technical indicators:
Trend Analysis:
The stock is testing a support level around ₹93.50, which has held in the past, suggesting potential for a bullish bounce.
The price is currently near a descending resistance line, showing that the stock is facing pressure but also indicating a potential breakout opportunity once it clears this resistance.
RSI (Relative Strength Index):
The RSI has been oscillating between the 40 and 60 mark, reflecting periods of overbought and oversold conditions.
Recently, the RSI has moved towards bullish territory, indicating growing buying interest. The last signals (green “Bull” labels) show positive momentum, which could suggest the start of an upward move.
MACD (Moving Average Convergence Divergence):
The MACD indicator is showing signs of bullish crossover, with the MACD line (orange) crossing above the signal line (blue), suggesting potential upward momentum in the near future.
The histogram also indicates that the bullish momentum is increasing, further confirming a possible trend reversal.
Key Points to Watch:
Support Zone: The stock is approaching a critical support level near ₹93.50. A bounce from this level could indicate a bullish trend continuation.
Breakout Opportunity: The price is testing the downward resistance trendline. A breakout above this level could trigger a strong upward move towards previous resistance levels around ₹110-115.
RSI & MACD Confirmation: The indicators show growing bullish momentum. A continued increase in RSI above 50 and a sustained positive MACD could confirm a bullish shift in the stock's direction.
Conclusion for Study:
This chart offers an example of how to analyze a stock’s price action, momentum, and trend through RSI, MACD, and support/resistance levels. Understanding how these indicators interact can help in forming strategies for potential entry or exit points in real-time trading scenarios.
This analysis is purely for educational purposes and should be viewed as a study of the stock's technicals.
منشورات ذات صلة
إخلاء المسؤولية
لا يُقصد بالمعلومات والمنشورات أن تكون، أو تشكل، أي نصيحة مالية أو استثمارية أو تجارية أو أنواع أخرى من النصائح أو التوصيات المقدمة أو المعتمدة من TradingView. اقرأ المزيد في شروط الاستخدام.
إخلاء المسؤولية
لا يُقصد بالمعلومات والمنشورات أن تكون، أو تشكل، أي نصيحة مالية أو استثمارية أو تجارية أو أنواع أخرى من النصائح أو التوصيات المقدمة أو المعتمدة من TradingView. اقرأ المزيد في شروط الاستخدام.