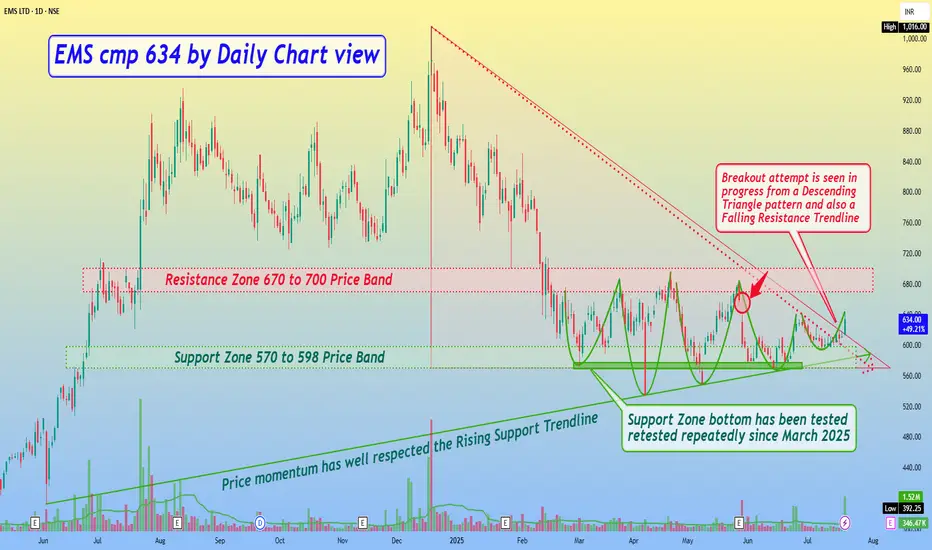
EMS cmp 634 by Daily Chart view
- Support Zone 570 to 598 Price Band
- Resistance Zone 670 to 700 Price Band
- Price momentum has well respected the Rising Support Trendline
- Support Zone bottom has been tested retested repeatedly since March 2025
- *Gap Down Opening of 29-May-2025 will act as tiny hurdle resistance crossing*
- Breakout attempt is seen in progress from a Descending Triangle pattern and also a Falling Resistance Trendline
إخلاء المسؤولية
لا يُقصد بالمعلومات والمنشورات أن تكون، أو تشكل، أي نصيحة مالية أو استثمارية أو تجارية أو أنواع أخرى من النصائح أو التوصيات المقدمة أو المعتمدة من TradingView. اقرأ المزيد في شروط الاستخدام.
إخلاء المسؤولية
لا يُقصد بالمعلومات والمنشورات أن تكون، أو تشكل، أي نصيحة مالية أو استثمارية أو تجارية أو أنواع أخرى من النصائح أو التوصيات المقدمة أو المعتمدة من TradingView. اقرأ المزيد في شروط الاستخدام.