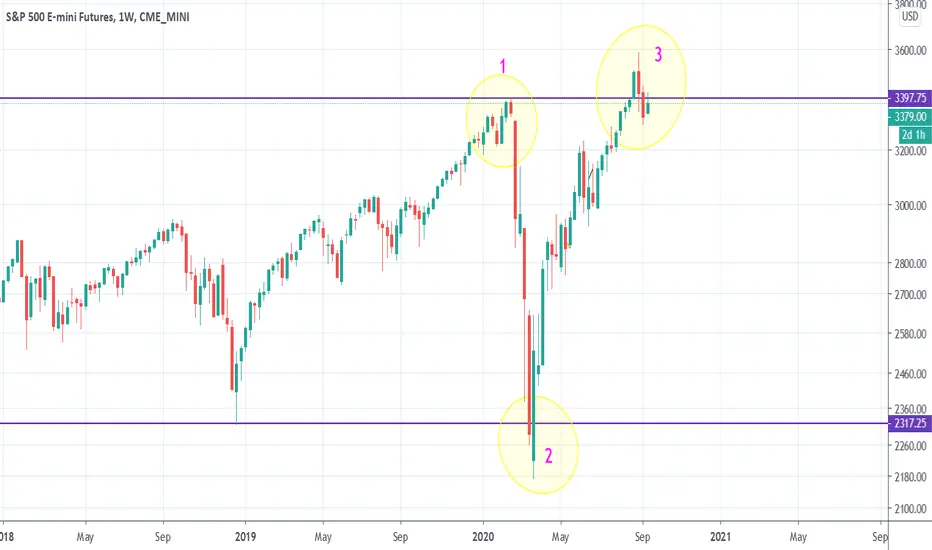
This is not a typical chart I post but something I'll keep an eye on for future development and my own curiosity. The main thing I want to note is the over shoot on figure 2 looks very similar to the overshoot on figure 3. If you noticed both are overshoots of previous lows/highs. The two horizontal blue lines represent the previous low and high.
ملاحظة
Very clear we need above 3400-3425 before I can be full on bull bias. Stimulus needs to be passed.ملاحظة
As long price holds outside the purple range price will gravitate upward.إخلاء المسؤولية
لا يُقصد بالمعلومات والمنشورات أن تكون، أو تشكل، أي نصيحة مالية أو استثمارية أو تجارية أو أنواع أخرى من النصائح أو التوصيات المقدمة أو المعتمدة من TradingView. اقرأ المزيد في شروط الاستخدام.
إخلاء المسؤولية
لا يُقصد بالمعلومات والمنشورات أن تكون، أو تشكل، أي نصيحة مالية أو استثمارية أو تجارية أو أنواع أخرى من النصائح أو التوصيات المقدمة أو المعتمدة من TradingView. اقرأ المزيد في شروط الاستخدام.