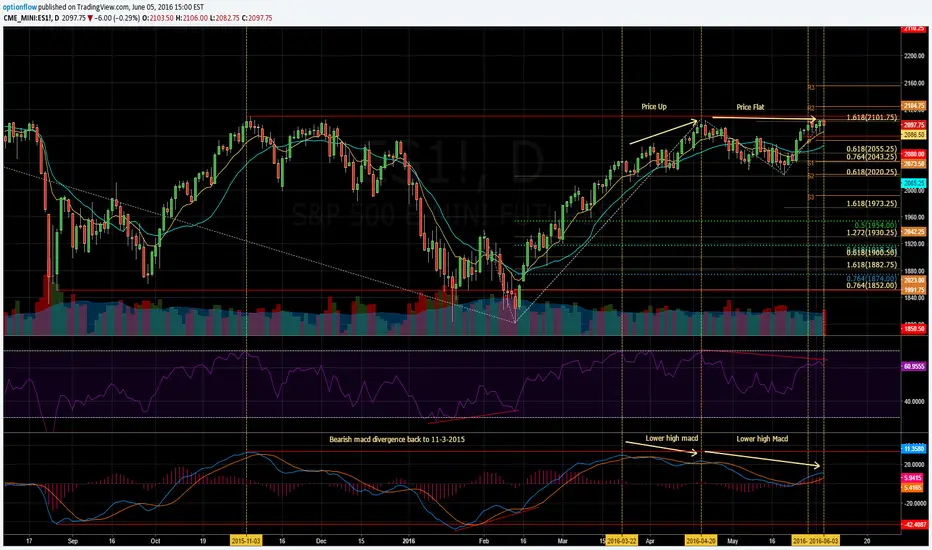
ES Macd making a series of lower highs dating back to 11-3-2015. We see the bullish divergence at the lows in February and now bearish divergences since 3-22-2016.
Price is with 5 handles of the 3-15 high at 2110.25.
If we look a the previous macd low from 8-2015, provides insight into where momentum may reverse on a steep pull back. Price macd low is 1850 and ironically where the only open ES gap is.
Doesn't mean it has to be filled on the next trip down.. 1973.25 -> 1930 -> 1882.75 are the most like likely downside targets.
That said, using fib trend extension from ATH's to the Feb low, then April high, 1852 is extremely interesting to me. In fact, would satisfy my downside objectives and fill the gap for a possible larger move to the upside for ATH's. Again, only a theory at this point. Need more data to support
منشورات ذات صلة
إخلاء المسؤولية
لا يُقصد بالمعلومات والمنشورات أن تكون، أو تشكل، أي نصيحة مالية أو استثمارية أو تجارية أو أنواع أخرى من النصائح أو التوصيات المقدمة أو المعتمدة من TradingView. اقرأ المزيد في شروط الاستخدام.
منشورات ذات صلة
إخلاء المسؤولية
لا يُقصد بالمعلومات والمنشورات أن تكون، أو تشكل، أي نصيحة مالية أو استثمارية أو تجارية أو أنواع أخرى من النصائح أو التوصيات المقدمة أو المعتمدة من TradingView. اقرأ المزيد في شروط الاستخدام.