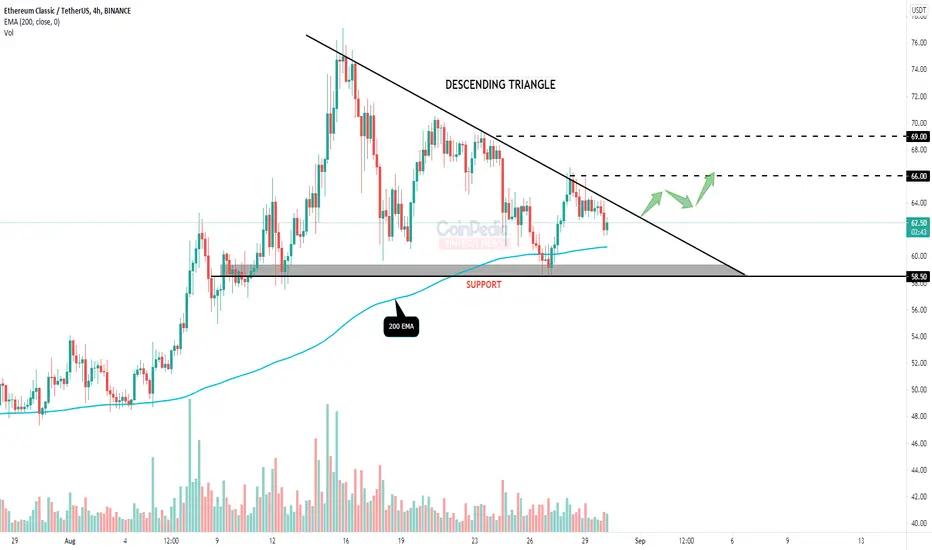
* Ethereum classic in 4H time frame forms a descending triangle with it's support near $58.5 and the above trend-line as it's resistance.
* The 200 EMA ( Exponential moving average ) is working as support for the price.
* If the price breaks the upper trend-line (resistance) we can expect a bullish move till $69.
* ETC is bearish below it's support zone.
* The 200 EMA ( Exponential moving average ) is working as support for the price.
* If the price breaks the upper trend-line (resistance) we can expect a bullish move till $69.
* ETC is bearish below it's support zone.
أغلقت الصفقة: تم الوصول للهدف
إخلاء المسؤولية
لا يُقصد بالمعلومات والمنشورات أن تكون، أو تشكل، أي نصيحة مالية أو استثمارية أو تجارية أو أنواع أخرى من النصائح أو التوصيات المقدمة أو المعتمدة من TradingView. اقرأ المزيد في شروط الاستخدام.
إخلاء المسؤولية
لا يُقصد بالمعلومات والمنشورات أن تكون، أو تشكل، أي نصيحة مالية أو استثمارية أو تجارية أو أنواع أخرى من النصائح أو التوصيات المقدمة أو المعتمدة من TradingView. اقرأ المزيد في شروط الاستخدام.