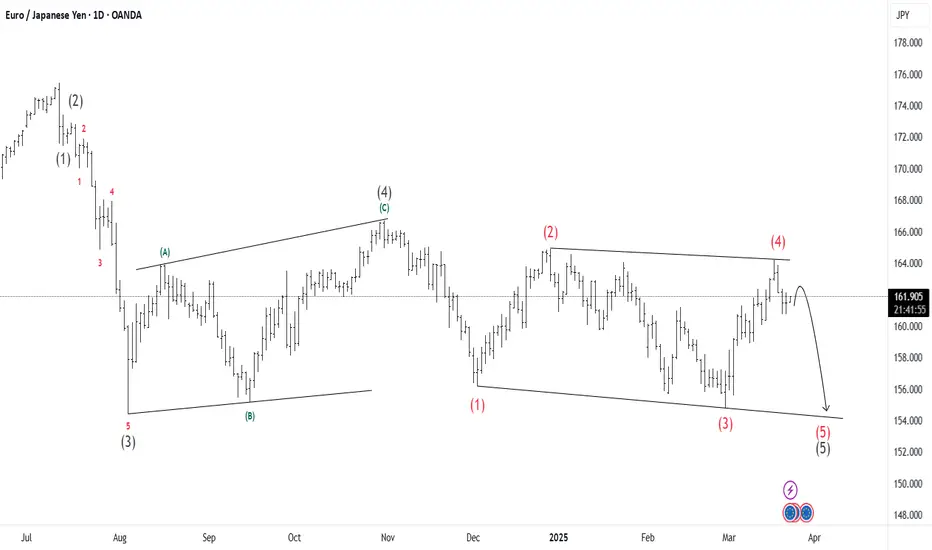
This EUR/JPY daily chart shows an Elliott Wave analysis, suggesting a possible bearish continuation. The current wave structure indicates the pair is moving through the final phase of a five-wave impulsive sequence.
The market has completed three waves of a larger impulsive cycle, with Wave (4)
The price movement between Wave (2) and Wave (4) shows a pause or slowdown after going up. This means the buyers are losing strength, and the price may soon start to fall
If the price gets rejected near 162.900, it could confirm further downside.
If it breaks below the 159.674 level, it may speed up the decline, with a possible target around 155.526 level.
إخلاء المسؤولية
لا يُقصد بالمعلومات والمنشورات أن تكون، أو تشكل، أي نصيحة مالية أو استثمارية أو تجارية أو أنواع أخرى من النصائح أو التوصيات المقدمة أو المعتمدة من TradingView. اقرأ المزيد في شروط الاستخدام.
إخلاء المسؤولية
لا يُقصد بالمعلومات والمنشورات أن تكون، أو تشكل، أي نصيحة مالية أو استثمارية أو تجارية أو أنواع أخرى من النصائح أو التوصيات المقدمة أو المعتمدة من TradingView. اقرأ المزيد في شروط الاستخدام.