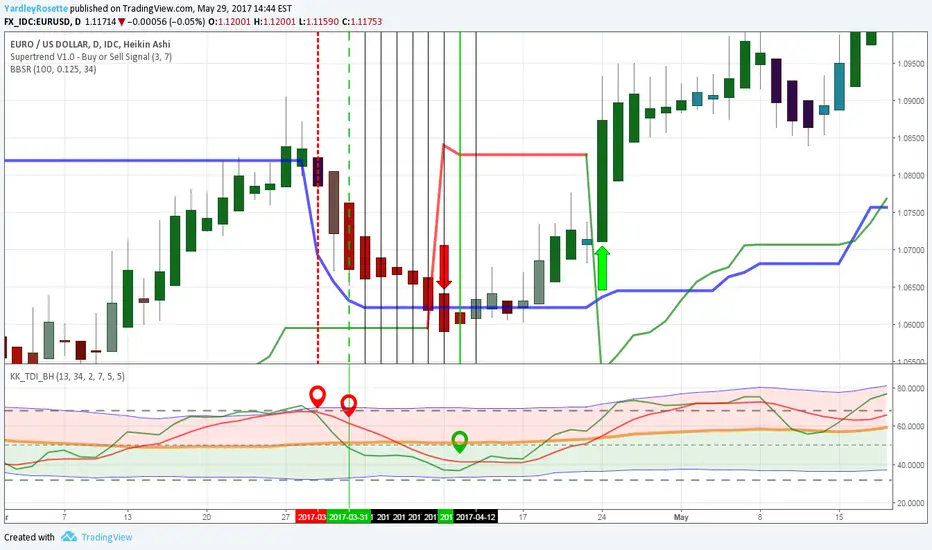
RSI/TSI cross down signal ocurred.
RSI/TSI remains bearish, though 1H Dynamic Index indication, simple/generic buy entry conditions/rules of:
RSI/TSI having been oversold, MBL risen from near 32, & RSI/TSI cross MBL up & RSI to cross above Volatility Band High were met.
Lower Time Frames indicate bullish movement within Daily chart.
Daily chart RSI/TSI cross up follows, bullish trend>>
إخلاء المسؤولية
لا يُقصد بالمعلومات والمنشورات أن تكون، أو تشكل، أي نصيحة مالية أو استثمارية أو تجارية أو أنواع أخرى من النصائح أو التوصيات المقدمة أو المعتمدة من TradingView. اقرأ المزيد في شروط الاستخدام.
إخلاء المسؤولية
لا يُقصد بالمعلومات والمنشورات أن تكون، أو تشكل، أي نصيحة مالية أو استثمارية أو تجارية أو أنواع أخرى من النصائح أو التوصيات المقدمة أو المعتمدة من TradingView. اقرأ المزيد في شروط الاستخدام.