EUR/USD Bullish Reversal Breakout Pattern 🚀📈
📊 Technical Analysis Summary:
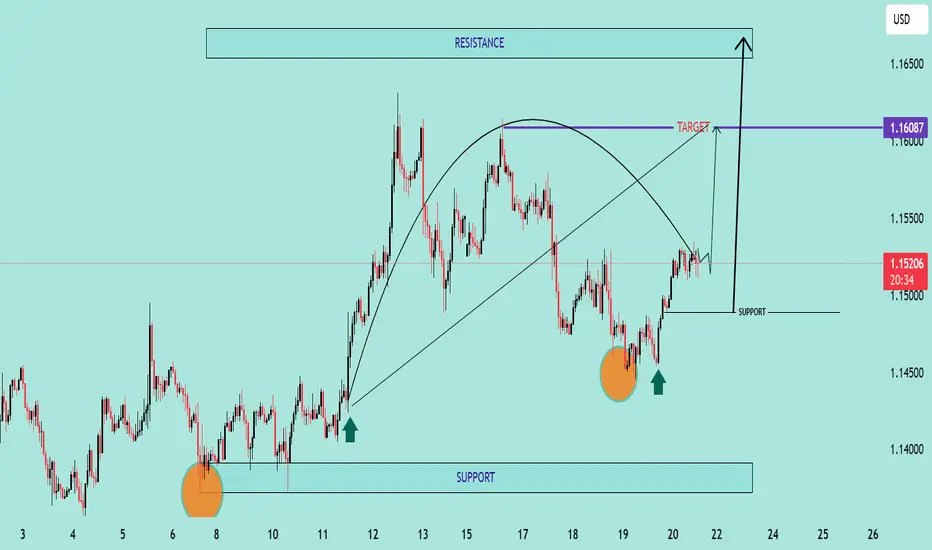
The chart illustrates a strong bullish reversal pattern forming on the EUR/USD pair:
🔹 Double Bottom Formation (🔶🔶):
Two clear bottom zones are marked with orange circles near the 1.14400–1.14500 area, indicating strong buying interest and support.
The second bottom confirms the double bottom pattern, often a precursor to an upward trend.
🔹 Support Zone (📉):
Firm support around 1.14450, as highlighted on the chart.
Price has respected this zone twice, bouncing back with bullish momentum each time.
🔹 Neckline Breakout (🔼):
Price is approaching the neckline zone at 1.16087, which acts as the bullish target.
A break and close above this neckline will confirm the reversal and open the way toward the resistance zone around 1.16500.
🔹 Projected Move (🎯):
If the neckline breaks, price is expected to surge towards 1.16500, aligning with the historical resistance.
This move completes the measured target projection from the double bottom structure.
🔹 Bullish Structure:
Higher lows and strong bullish candles are reinforcing the uptrend momentum.
Curved trajectory shows accumulation followed by a breakout phase.
📌 Key Levels to Watch:
Support: 1.14450 – 1.14500
Neckline/Target: 1.16087
Resistance: 1.16500
🛑 Invalidation:
A strong breakdown below support (1.14450) would invalidate this bullish setup.
✅ Conclusion:
EUR/USD is exhibiting a textbook bullish reversal setup with a potential breakout above 1.16087 likely to trigger further upside toward 1.16500. Ideal scenario for bullish entries on
📊 Technical Analysis Summary:
The chart illustrates a strong bullish reversal pattern forming on the EUR/USD pair:
🔹 Double Bottom Formation (🔶🔶):
Two clear bottom zones are marked with orange circles near the 1.14400–1.14500 area, indicating strong buying interest and support.
The second bottom confirms the double bottom pattern, often a precursor to an upward trend.
🔹 Support Zone (📉):
Firm support around 1.14450, as highlighted on the chart.
Price has respected this zone twice, bouncing back with bullish momentum each time.
🔹 Neckline Breakout (🔼):
Price is approaching the neckline zone at 1.16087, which acts as the bullish target.
A break and close above this neckline will confirm the reversal and open the way toward the resistance zone around 1.16500.
🔹 Projected Move (🎯):
If the neckline breaks, price is expected to surge towards 1.16500, aligning with the historical resistance.
This move completes the measured target projection from the double bottom structure.
🔹 Bullish Structure:
Higher lows and strong bullish candles are reinforcing the uptrend momentum.
Curved trajectory shows accumulation followed by a breakout phase.
📌 Key Levels to Watch:
Support: 1.14450 – 1.14500
Neckline/Target: 1.16087
Resistance: 1.16500
🛑 Invalidation:
A strong breakdown below support (1.14450) would invalidate this bullish setup.
✅ Conclusion:
EUR/USD is exhibiting a textbook bullish reversal setup with a potential breakout above 1.16087 likely to trigger further upside toward 1.16500. Ideal scenario for bullish entries on
JOIN MY TELEGRAM CHANNEL
t.me/StellarMarketAnalysis
JOIN MY RECOMMENTED BROKER REFFREL LINK
⤵️one.exnesstrack.net/a/uvd1etcgg1
PARTNER CODE⤵️
uvd1etcgg1
t.me/StellarMarketAnalysis
JOIN MY RECOMMENTED BROKER REFFREL LINK
⤵️one.exnesstrack.net/a/uvd1etcgg1
PARTNER CODE⤵️
uvd1etcgg1
إخلاء المسؤولية
لا يُقصد بالمعلومات والمنشورات أن تكون، أو تشكل، أي نصيحة مالية أو استثمارية أو تجارية أو أنواع أخرى من النصائح أو التوصيات المقدمة أو المعتمدة من TradingView. اقرأ المزيد في شروط الاستخدام.