Context:
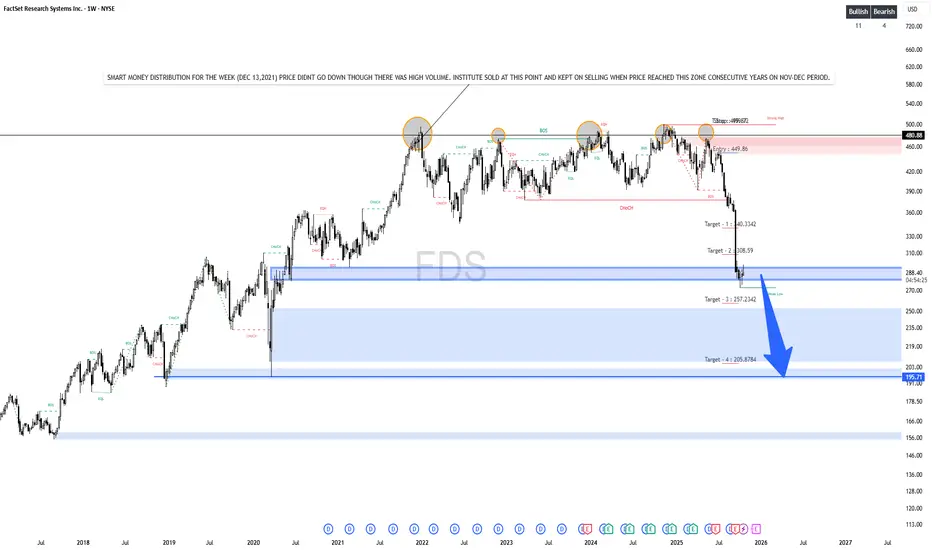
The chart highlights a Smart Money Distribution phase around Dec 2021, where institutions sold heavily near the $480–$500 zone.
Each time price reached this zone during Nov–Dec in consecutive years, it faced institutional selling pressure.
🧠 Market Structure & Analysis:
Multiple Equal Highs (EQH) and Breaks of Structure (BOS) confirm distribution and shift from bullish to bearish trend.
A major Change of Character (CHoCH) occurred, signaling a trend reversal.
The chart shows a clear downtrend with consecutive lower highs and lower lows.
📉 Trade Setup:
Entry Zone: Around $450 after the CHoCH and BOS confirmation.
Distribution Zone (Institutional Sell Zone): $460–$500 range (highlighted red box).
Targets:
🎯 Target 1: $340.33 (hit)
🎯 Target 2: $308.59 (hit)
🎯 Target 3: $257.23 (approaching support)
🎯 Target 4: $205.87 (final target – marked by the large blue arrow)**
⚠️ Key Notes:
Current price (~$287) is near Target 3 zone, a potential temporary support area.
If liquidity breaks below $257, momentum could extend to $205–$210 (major demand zone from 2020).
Volume analysis suggests smart money continues offloading positions; little evidence of accumulation yet.
🧭 Bias:
Primary Bias: Bearish
Short-term Outlook: Potential small bounce from $257–$287 zone.
إخلاء المسؤولية
لا يُقصد بالمعلومات والمنشورات أن تكون، أو تشكل، أي نصيحة مالية أو استثمارية أو تجارية أو أنواع أخرى من النصائح أو التوصيات المقدمة أو المعتمدة من TradingView. اقرأ المزيد في شروط الاستخدام.
إخلاء المسؤولية
لا يُقصد بالمعلومات والمنشورات أن تكون، أو تشكل، أي نصيحة مالية أو استثمارية أو تجارية أو أنواع أخرى من النصائح أو التوصيات المقدمة أو المعتمدة من TradingView. اقرأ المزيد في شروط الاستخدام.