Actionable Insight:
Wait for a daily close above $0.00000078 for a long entry, targeting $0.0000010. Stop-loss at $0.00000075. Avoid trading if volume doesn’t pick up.
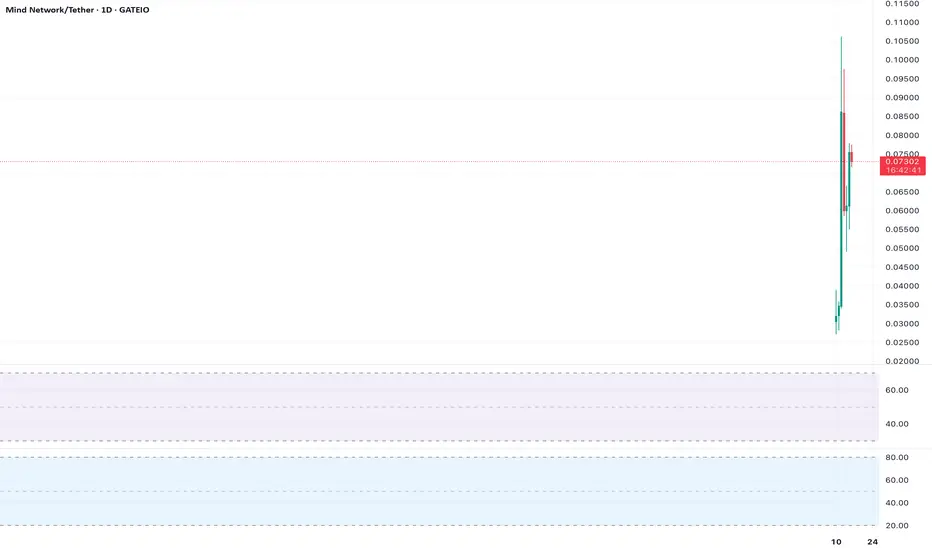
Chart Setup:
Timeframe: Daily
Indicators: 200-day EMA, RSI
Levels: Support ($0.00000078), Target ($0.0000010)
إخلاء المسؤولية
لا يُقصد بالمعلومات والمنشورات أن تكون، أو تشكل، أي نصيحة مالية أو استثمارية أو تجارية أو أنواع أخرى من النصائح أو التوصيات المقدمة أو المعتمدة من TradingView. اقرأ المزيد في شروط الاستخدام.
إخلاء المسؤولية
لا يُقصد بالمعلومات والمنشورات أن تكون، أو تشكل، أي نصيحة مالية أو استثمارية أو تجارية أو أنواع أخرى من النصائح أو التوصيات المقدمة أو المعتمدة من TradingView. اقرأ المزيد في شروط الاستخدام.