TICKER: G (Genpact Limited)
TIMEFRAME: Daily + 4H + 1H (Rare Triple Alignment)
STRATEGY: Trend Continuation with Exceptional Fundamentals
📊 TECHNICAL ANALYSIS - TRIPLE BULLISH CONFIRMATION
MULTI-TIMEFRAME ALIGNMENT:
• DAILY: 🟢 BULLISH Trend, 🟢 BUY Signal
• 4HOUR: 🟢 BULLISH Trend, 🟢 BUY Signal
• 1HOUR: 🟢 BULLISH Trend, 🟢 BUY Signal
Rare perfect alignment across all timeframes
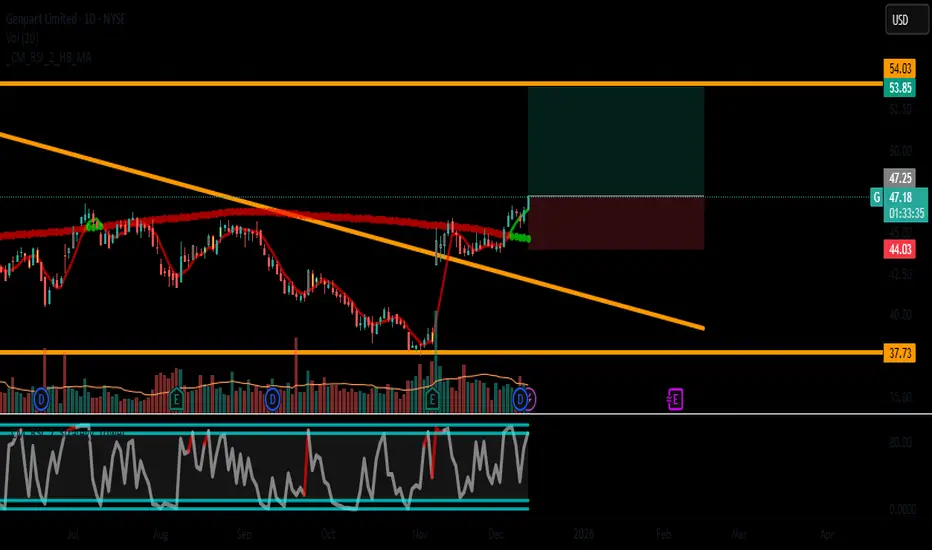
KEY LEVELS:
Current Price: ~$46.40
Immediate Target: $47.80 (Bollinger Upper Band)
Major Target: $53.51 (Fibonacci 161.8% Extension)
Critical Support: $44.00 (Strong Multi-Support Zone)
INDICATOR CONFIRMATION:
• RSI Daily: 70.7 (Strong momentum, NOT overbought)
• MACD: Bullish across all timeframes
• Bollinger Bands: Price riding upper band (strength)
• SMA Stack: Price > SMA20 > SMA50 (Perfect order)
• Volume: Consistent above average
CHART PATTERN:
Flag Pattern consolidation after breakout
Higher Highs & Higher Lows since September
Cup & Handle formation completing
💼 FUNDAMENTAL SUPERIORITY
EXCEPTIONAL SCORE: 10/10
text
• DEBT/Equity: 0.33 (Excellent balance sheet)
• P/E Ratio: 15.0 (Fair valuation)
• Interest Coverage: 7.7x (Strong solvency)
• Revenue Growth: +6.5% YoY
SECTOR ADVANTAGE:
Business Services sector outperforming
Digital Transformation tailwinds
Global BPO Leader - market position strength
INSTITUTIONAL SUPPORT:
88% institutional ownership
Recent analyst upgrades
Strong insider buying
🎯 TRADE PARAMETERS - HIGH PROBABILITY SETUP
ENTRY ZONE: $46.80 - $47.20
Ideal entry on slight pullback to trendline
STOP LOSS: $44.00 (-6.4%)
Below Daily SMA50
Below recent swing low
Below psychological $44 support
TAKE PROFIT: $53.51 (+13.8%)
161.8% Fibonacci extension
Measured move from flag pattern
Previous all-time high resistance
RISK/REWARD: 1:2.16 (Excellent)
📅 TIMEFRAME & POSITION MANAGEMENT
TRADE DURATION: 4-8 weeks
SMART POSITIONING:
STAGE 1 (50%): Entry at $47.00
STAGE 2 (30%): Add at $46.50 if retested
STAGE 3 (20%): Add on break above $48.50
PROFIT TAKING STRATEGY:
25% at $49.50 (Resistance break)
25% at $51.00 (Psychological level)
50% at $53.51 (Final target)
TRAILING STOP:
Breakeven at $48.00
Trail 8% after $50.00
Final stop at $49.50
⚠️ RISK MITIGATION
MONITOR THESE SIGNALS:
Daily RSI: Watch for divergence above 75
Volume: Should expand on breakout
Sector Rotation: Out of services into tech
Market Sentiment: Overall bullish bias needed
INVALIDATION CONDITIONS:
Daily close below $45.74 (immediate support)
RSI reversal with price making new highs
Volume dries up on upward moves
📈 PRICE SCENARIOS & PROBABILITIES
PRIMARY (75%): $53.51 Target Hit
Clean breakout, steady uptrend
Fundamentals continue to support
Sector remains favorable
SECONDARY (20%): $51.00 Partial Profit
Resistance at $51 holds initially
Consolidation before final push
Still profitable trade
MINOR (5%): Stop Loss Hit
Market correction or sector rotation
Unexpected fundamental news
Failed breakout scenario
🏆 WHY THIS IS A TOP-TIER TRADE
Rare Triple Alignment: All timeframes bullish
Fundamental Excellence: Perfect 10/10 score
Technical Precision: Clear levels, high probability
Risk Management: Favorable R/R ratio
Catalyst Ready: Sector tailwinds + institutional support
EDGE FACTORS:
No contradictory Connors signals
Low float stock with institutional accumulation
Consistent earnings growth history
Strong technical structure
📌 EXECUTION CHECKLIST
[ ] CONFIRM: Daily close above $46.50
[ ] CONFIRM: RSI maintaining above 65
[ ] CONFIRM: Volume > 1.2M shares
[ ] ENTRY: $47.00 zone
[ ] STOP: $44.00 (hard stop)
[ ] TARGET: $53.51 (scale out)
TRADE SIZE RECOMMENDATION: 3-4% portfolio allocation
CONFIDENCE LEVEL: 8.5/10
PATIENCE REQUIRED: Medium (weeks, not days)
Disclaimer: This analysis is for educational purposes. Past performance doesn't guarantee future results. Always conduct your own research and consult with a financial advisor.
✅ LIKE if you agree with this setup!
💬 COMMENT your take on G below!
🔔 FOLLOW for more high-probability trades!
🔄 SHARE with fellow traders!
#G #Genpact #Trading #Stocks #Investing #TechnicalAnalysis #FundamentalAnalysis #Breakout #TradingView #StockMarket
TIMEFRAME: Daily + 4H + 1H (Rare Triple Alignment)
STRATEGY: Trend Continuation with Exceptional Fundamentals
📊 TECHNICAL ANALYSIS - TRIPLE BULLISH CONFIRMATION
MULTI-TIMEFRAME ALIGNMENT:
• DAILY: 🟢 BULLISH Trend, 🟢 BUY Signal
• 4HOUR: 🟢 BULLISH Trend, 🟢 BUY Signal
• 1HOUR: 🟢 BULLISH Trend, 🟢 BUY Signal
Rare perfect alignment across all timeframes
KEY LEVELS:
Current Price: ~$46.40
Immediate Target: $47.80 (Bollinger Upper Band)
Major Target: $53.51 (Fibonacci 161.8% Extension)
Critical Support: $44.00 (Strong Multi-Support Zone)
INDICATOR CONFIRMATION:
• RSI Daily: 70.7 (Strong momentum, NOT overbought)
• MACD: Bullish across all timeframes
• Bollinger Bands: Price riding upper band (strength)
• SMA Stack: Price > SMA20 > SMA50 (Perfect order)
• Volume: Consistent above average
CHART PATTERN:
Flag Pattern consolidation after breakout
Higher Highs & Higher Lows since September
Cup & Handle formation completing
💼 FUNDAMENTAL SUPERIORITY
EXCEPTIONAL SCORE: 10/10
text
• DEBT/Equity: 0.33 (Excellent balance sheet)
• P/E Ratio: 15.0 (Fair valuation)
• Interest Coverage: 7.7x (Strong solvency)
• Revenue Growth: +6.5% YoY
SECTOR ADVANTAGE:
Business Services sector outperforming
Digital Transformation tailwinds
Global BPO Leader - market position strength
INSTITUTIONAL SUPPORT:
88% institutional ownership
Recent analyst upgrades
Strong insider buying
🎯 TRADE PARAMETERS - HIGH PROBABILITY SETUP
ENTRY ZONE: $46.80 - $47.20
Ideal entry on slight pullback to trendline
STOP LOSS: $44.00 (-6.4%)
Below Daily SMA50
Below recent swing low
Below psychological $44 support
TAKE PROFIT: $53.51 (+13.8%)
161.8% Fibonacci extension
Measured move from flag pattern
Previous all-time high resistance
RISK/REWARD: 1:2.16 (Excellent)
📅 TIMEFRAME & POSITION MANAGEMENT
TRADE DURATION: 4-8 weeks
SMART POSITIONING:
STAGE 1 (50%): Entry at $47.00
STAGE 2 (30%): Add at $46.50 if retested
STAGE 3 (20%): Add on break above $48.50
PROFIT TAKING STRATEGY:
25% at $49.50 (Resistance break)
25% at $51.00 (Psychological level)
50% at $53.51 (Final target)
TRAILING STOP:
Breakeven at $48.00
Trail 8% after $50.00
Final stop at $49.50
⚠️ RISK MITIGATION
MONITOR THESE SIGNALS:
Daily RSI: Watch for divergence above 75
Volume: Should expand on breakout
Sector Rotation: Out of services into tech
Market Sentiment: Overall bullish bias needed
INVALIDATION CONDITIONS:
Daily close below $45.74 (immediate support)
RSI reversal with price making new highs
Volume dries up on upward moves
📈 PRICE SCENARIOS & PROBABILITIES
PRIMARY (75%): $53.51 Target Hit
Clean breakout, steady uptrend
Fundamentals continue to support
Sector remains favorable
SECONDARY (20%): $51.00 Partial Profit
Resistance at $51 holds initially
Consolidation before final push
Still profitable trade
MINOR (5%): Stop Loss Hit
Market correction or sector rotation
Unexpected fundamental news
Failed breakout scenario
🏆 WHY THIS IS A TOP-TIER TRADE
Rare Triple Alignment: All timeframes bullish
Fundamental Excellence: Perfect 10/10 score
Technical Precision: Clear levels, high probability
Risk Management: Favorable R/R ratio
Catalyst Ready: Sector tailwinds + institutional support
EDGE FACTORS:
No contradictory Connors signals
Low float stock with institutional accumulation
Consistent earnings growth history
Strong technical structure
📌 EXECUTION CHECKLIST
[ ] CONFIRM: Daily close above $46.50
[ ] CONFIRM: RSI maintaining above 65
[ ] CONFIRM: Volume > 1.2M shares
[ ] ENTRY: $47.00 zone
[ ] STOP: $44.00 (hard stop)
[ ] TARGET: $53.51 (scale out)
TRADE SIZE RECOMMENDATION: 3-4% portfolio allocation
CONFIDENCE LEVEL: 8.5/10
PATIENCE REQUIRED: Medium (weeks, not days)
Disclaimer: This analysis is for educational purposes. Past performance doesn't guarantee future results. Always conduct your own research and consult with a financial advisor.
✅ LIKE if you agree with this setup!
💬 COMMENT your take on G below!
🔔 FOLLOW for more high-probability trades!
🔄 SHARE with fellow traders!
#G #Genpact #Trading #Stocks #Investing #TechnicalAnalysis #FundamentalAnalysis #Breakout #TradingView #StockMarket
إخلاء المسؤولية
لا يُقصد بالمعلومات والمنشورات أن تكون، أو تشكل، أي نصيحة مالية أو استثمارية أو تجارية أو أنواع أخرى من النصائح أو التوصيات المقدمة أو المعتمدة من TradingView. اقرأ المزيد في شروط الاستخدام.
إخلاء المسؤولية
لا يُقصد بالمعلومات والمنشورات أن تكون، أو تشكل، أي نصيحة مالية أو استثمارية أو تجارية أو أنواع أخرى من النصائح أو التوصيات المقدمة أو المعتمدة من TradingView. اقرأ المزيد في شروط الاستخدام.